EUR / USD
Source: Massive (polygon.io)
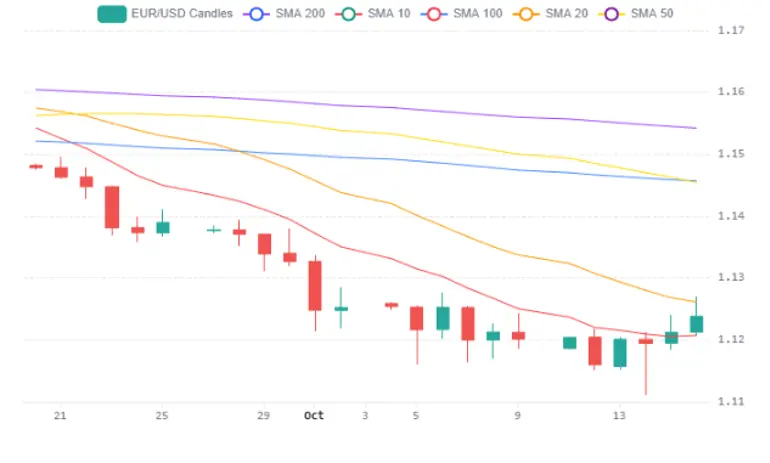
EUR/USD bounced back last week as the dollar’s strength unwound, with weakness in equities and geopolitical uncertainty driving demand for Treasuries and pulling US yields lower despite the inflation surprise. In overnight trading ahead of Monday morning, however, the pair gapped lower once again, dropping below 1.1200 as the dollar proved more resilient. With US yields still elevated and Fed tightening expectations intact, the move is unlikely to develop into a more sustained bout of dollar weakness. The pair remains well below its 200-day and 50-day moving averages at 1.15, confirming the firmly bearish structural backdrop after shedding roughly 3.2% over the past month. The interest-rate differential continues to favour the dollar, with US CPI at 3.7% reinforcing expectations of further Fed tightening — market pricing now assigns a 74% probability to a December hike — while a 10-year Treasury yield still above 5% amplifies the greenback's yield advantage.
On the euro side, ECB rate hikes lack the same currency-supportive punch because they land on a fragile European economy already battered by energy costs, with Brent crude above $100 per barrel disproportionately burdening energy-importing Europe. France's fiscal deterioration — with debt at 119% of GDP, a 5.4% deficit, and bond yields at two-decade highs amid political gridlock and potential credit downgrade — introduces a sovereign risk premium that weighs heavily on broader eurozone sentiment and raises the spectre of capital flight given the 56% foreign ownership of French state debt.
Technically, the 20-day moving average near 1.13 converges with the rolling VWAP to form a dense resistance zone, while Friday's sharp 40-pip pullback from the 1.1260 area confirmed that sellers remain active on upticks. The daily RSI's recovery into the upper 30s from deeply oversold levels suggests a temporary reprieve, but absent a decisive reclaim of the 1.13 handle, the path of least resistance points toward a retest of the recent 1.1116 low. The confluence of widening rate differentials, European fiscal fragility, and persistent energy headwinds leaves the euro structurally disadvantaged, with meaningful upside likely capped until the macro narrative shifts decisively.
USD / JPY
Source: Massive (polygon.io)
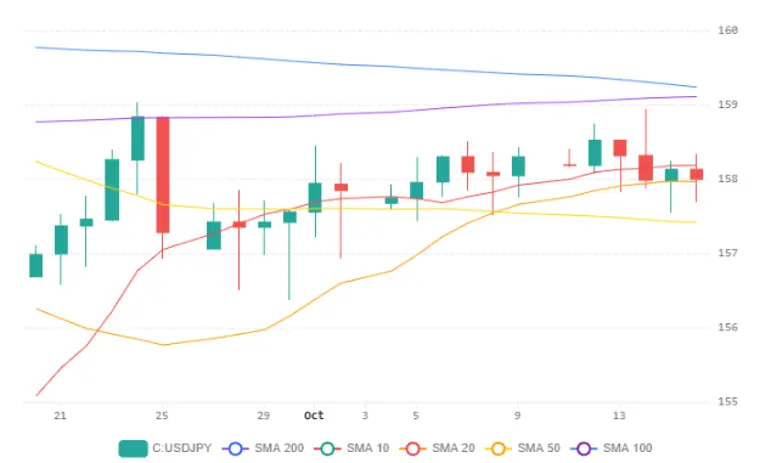
USD/JPY remains locked in an exceptionally tight consolidation phase, with the pair oscillating within a compressed 0.4% range between approximately 157.70 and 158.31, while realized volatility over the past two weeks has fallen to just 2.57% — placing it in the 0.44th percentile of all rolling ten-session windows since 1988. Price currently sits near 158, sandwiched between the 20-day SMA acting as immediate resistance and a support cluster formed by the 50-day SMA around 157.42 and the 30-day rolling VWAP at 157.46, with the 200-day SMA overhead at approximately 159 representing a significant ceiling that has capped rallies in recent months. The daily RSI hovering around 53 confirms neutral momentum with no directional conviction, consistent with the subdued price action.
The fundamental backdrop continues to anchor the pair near current levels, as the wide interest rate differential between the US and Japan persists despite the Bank of Japan raising its benchmark rate to a 31-year high of 1.25% in September. The market views the BOJ's normalisation path as too gradual to meaningfully narrow yield spreads, while accelerating US inflation pressures and mortgage rates near 7.5% keep expectations alive for continued Fed tightening. Japan's aggressive fiscal expansion on semiconductor and AI investments further compounds yen weakness by raising concerns about fiscal soundness and currency dilution.
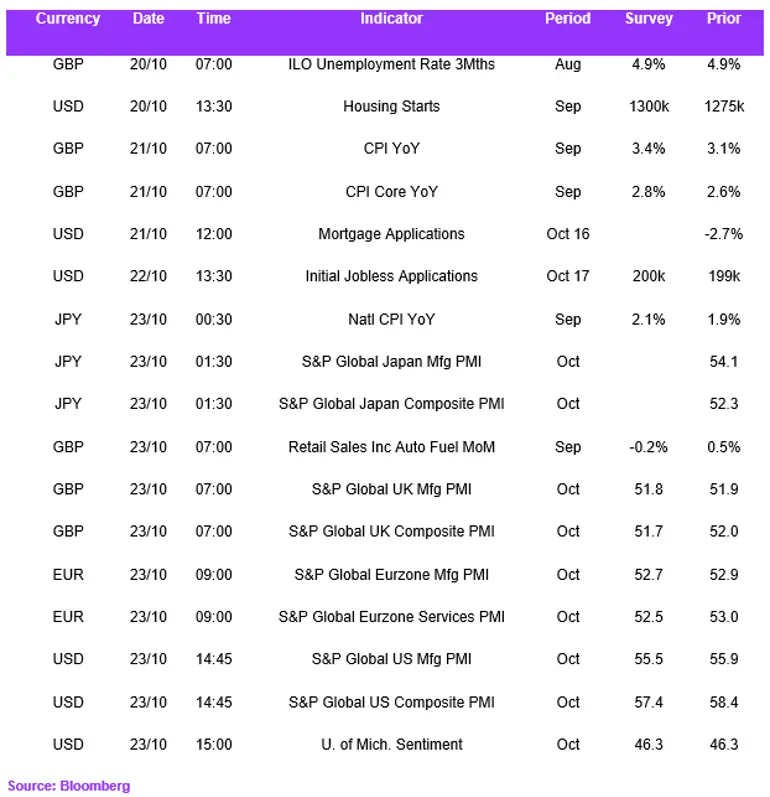
Looking ahead, the Federal Reserve's media blackout and a relatively light US economic calendar — combined with Japanese national CPI data due Friday — suggest limited near-term catalysts for a decisive breakout, leaving the pair poised to remain range-bound unless a significant macro shock materializes to challenge the 157.40–157.50 support zone or the 159 resistance ceiling.
GBP / USD
Source: Massive (polygon.io)
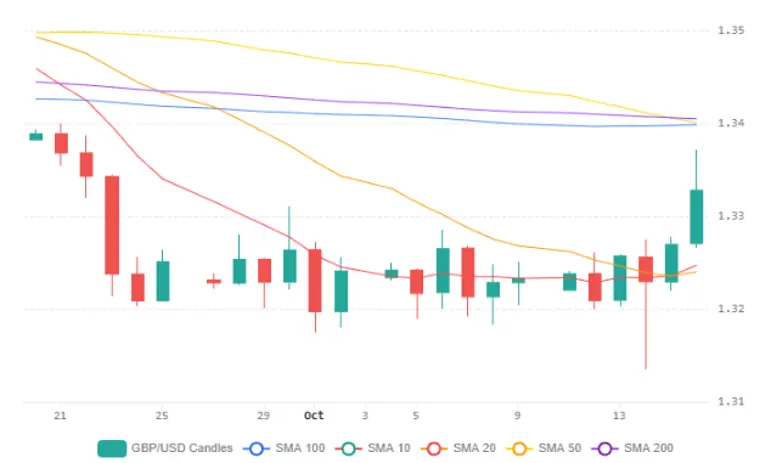
GBP/USD rallied on Friday to close at approximately 1.3328, supported by lower US Treasury yields, reduced expectations of near-term Fed tightening and stronger-than-expected UK growth data, which encouraged short-covering in sterling. The move broke above the 20-day moving average at 1.3250 and the psychological 1.3300 level, both of which should now provide firmer support for the currency this week. Still, the later retracement from 1.3372 and looming resistance from the higher moving averages should limit further upside, with 1.3400 appearing strongly defensible. The daily RSI has recovered to roughly 54 from deeply oversold readings near 35, signalling a short-term momentum reversal, though the broader macro backdrop suggests this relief rally may struggle to hold.
Indeed, the pair faces significant headwinds from a widening monetary policy divergence between the Federal Reserve and the Bank of England, with the Fed maintaining a more aggressive tightening posture — having raised rates to 3.75%–4.00% with further hikes expected — while the BOE remains cautious despite UK inflation projected to reach 4% in early 2027. This divergence is compounded by speculative positioning turning sharply bearish on sterling, with net short positions reaching approximately $8 billion, their highest since early 2017, as markets express deep scepticism about the UK's fiscal trajectory ahead of the October 28 Budget.
Elevated energy costs — with Brent crude above $100 — act as a persistent inflationary drag on the energy-importing UK economy while simultaneously bolstering the dollar through safe-haven flows, and any budget announcement perceived as lacking fiscal credibility, while deteriorating global risk appetite ahead of U.S. midterm elections provides an additional tailwind for dollar strength. The balance of risks remains tilted to the downside for GBP/USD, but with the most recent breakout, the support looks more established at the 1.33000 and the 20SMA level of 1.3250.
Economic Calendar