


2026 Outlook
Looking ahead to 2026, trying to forecast where markets are headed can feel like a daunting task. New data and ever-changing policy statements keep shifting the consensus, with sentiment running the show. Ever since Trump stepped into power for his second term last year, his ever-changing proclamations on the economy, on tariffs, on his ability to steer it all, sent April’s markets spinning.
Ever since then, speculative flows took over the narrative, amplifying every signal to the point of exhaustion. Commodities felt this most acutely: copper, silver, and gold all began moving in tandem - massive appetite, yet little fundamental clarity.
While the future remains uncertain, we believe it is prudent to keep our focus tight, shorten our time horizons, and focus on identifying risks and hedging opportunities, rather than attempting to predict price movements for this year.
In this report, we address the key questions and potential risks for 2026, aiming to understand the underlying reality in the market, which appears to be increasingly driven by speculation.
US Midterm Elections
Will the 2026 midterms raise fiscal and policy risk premia?
The 2026 US midterm elections are likely to act as a source of policy and market volatility well before polling day, as investors begin to price the risk of legislative gridlock or, conversely, a reinforced mandate. Historically, midterms tend to be challenging for the party in the White House, and the market relevance lies less in the result itself than in how expectations around fiscal policy and regulation through the year. In a macro environment already sensitive to credibility and term premia, election uncertainty can become an additional driver of risk pricing rather than a standalone political event.
From a market perspective, attention is likely to focus on a small group of competitive states that shape control of Congress and signal national voter sentiment. In particular, Michigan, Pennsylvania and Wisconsin remain critical bellwethers in the industrial Midwest, where labour markets and manufacturing policy are politically salient. In the Sun Belt, Arizona, Georgia and North Carolina are likely to remain closely contested, reflecting demographic change and suburban voting behaviour. Outcomes and polling trends in these states tend to shape expectations for Senate control and, by extension, the scope for fiscal and regulatory action.
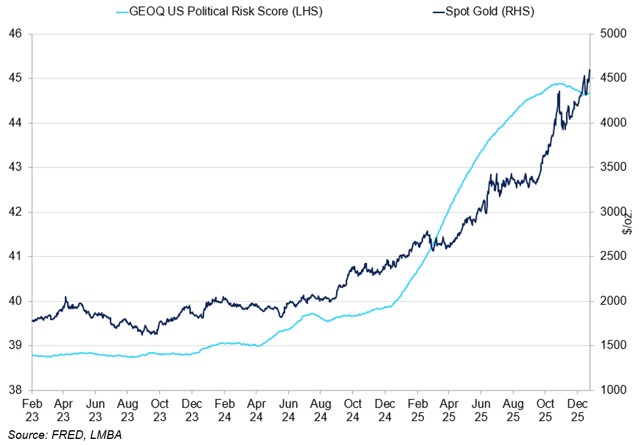
GEOQ US Political Risk vs Spot Gold
Political risk has risen into 2026, with gold tracing the build-up.
Ahead of the elections, we expect policy signalling to tilt towards measures that can be framed as immediate economic relief or visible support for households and employment. Health insurance subsidies are likely to remain a focal point, given their direct impact on household disposable income and their role in recent budget confrontations. We expect renewed debate around extending or expanding subsidy support, particularly as expiration deadlines approach, which raises the risk of further fiscal brinkmanship. We also see a high likelihood of firmer trade and industrial rhetoric, especially where it resonates with swing state voters, even if concrete policy implementation remains limited. For markets, the effect is less about enacted legislation and more about rising uncertainty around fiscal trajectories and trade relationships.
In market terms, rates are likely to be the first transmission channel, as shifting expectations around fiscal discipline and gridlock feed into term premia. While a higher probability of political constraint can be modestly supportive for duration, election uncertainty itself can keep volatility elevated. FX impacts are more likely to operate through changes in risk sentiment and trade expectations rather than politics alone, while equities may see sector level rotation driven by evolving rhetoric around healthcare, energy, defence and infrastructure. Overall, we see the 2026 midterms as a background catalyst that adds noise and risk premia across assets, rather than a single directional driver.
US Labour Weakness
Will US Labour Performance Weaken Sharply in 2026?
Concerns are mounting that US labour performance could weaken sharply this year, with some economists projecting unemployment as high as 6.0%. Employment slowed in 2025, primarily due to weaker hiring, and concerns have risen that this deceleration could persist or even accelerate in 2026. Several factors explain the 2025 slowdown. Elevated interest rates, despite the Fed's rate cuts, and additional policy uncertainty from Trump’s trade and political shifts weighed on hiring. By year-end, the labour market shifted from “tight” to “balanced/soft,” with rising downside risk. However, despite hiring and unemployment rising to 4.6%, layoffs remained at historically low levels.
We believe that for 2026, the outlook hinges on hiring pace: if 2025 trends persist, payroll growth will remain weak even with moderate labour force growth. As a result, unemployment could rise by 0.3–0.7pp to 4.9–5.3%; in the worst-case scenario, it could reach 5.5–6.2%. The main market risk is Sahm rule proximity - a recession signal triggered if the 3-month average unemployment rate rises by 0.5pp above its prior 12-month low. As of November, the Sahm rule stands at 0.43. A few more months of mild deterioration could trigger it, so markets remain on edge for any negative surprises. While a true recession is unlikely, risks are tilted to the downside.
Sahm Rule vs US Initial Jobless Claims
Sahm rule has been rising since summer 2025, raising the risk of labour-driven recession.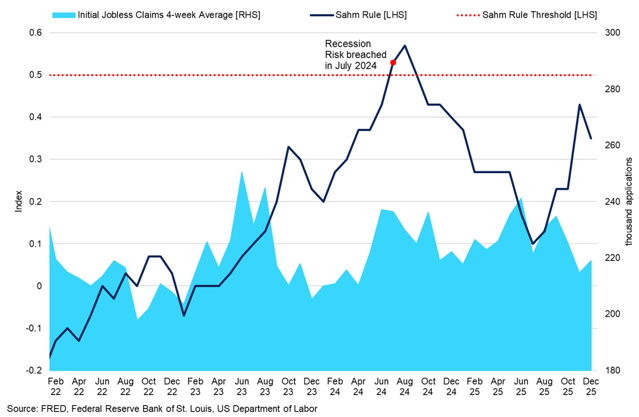
Other key trends we watch for is ongoing weak hiring rather than a wave of layoffs, unless firms feel overstaffed.
Key labour indicators:
- Initial claims trend
- JOLTS layoffs and hire rates
- Part-time for economic reasons
To trigger panic, unemployment must rise enough to reach Sahm's 0.50 threshold, accompanied by sustained increases in claims (4-week average) and a rising JOLTS layoffs rate. A rapid rise in unemployment could spark fears of a US recession, even without a GDP downturn - pressuring Treasury yields, weakening the dollar, and fuelling broader risk-off moves and safe-haven demand.
Fed Succession Risk
Are we going to see a more politically driven Fed?
The defining macro event risk in 2026 is the Federal Reserve chair transition. Fed Chair Jerome Powell’s term expires in May 2026, with the nomination process likely to begin early in the year and a handover that could plausibly take place in time for the June FOMC. The market relevance is not the biography of the next chair itself, but how the appointment might shape the Fed’s reaction function. That is whether the Fed is seen as quicker to prioritise growth and labour market risks or more exposed to political influence. We expect uncertainty about the Fed’s reaction function to be expressed initially in front-end rates, with a subsequent adjustment in credit and long-dated bonds as term premia rise.
MOVE Index vs US 2Y Treasury Yield (Rebased to 1 July 2025 = 100)
Bond volatility and front-end yields have been drifting lower, but the coming year threatens to reintroduce policy instability.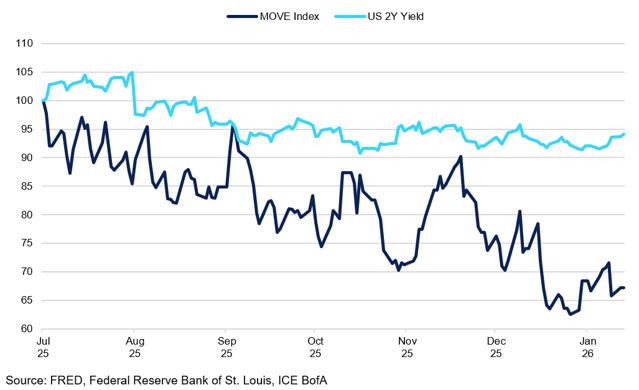
In terms of plausible successors, markets are likely to focus less on a wide field of names and more on the signal sent by a continuity versus recalibration choice. At present, Kevin Hassett is widely viewed as the most likely candidate. His appointment would be interpreted as a shift towards a more overtly growth focused policy framework, with greater emphasis on employment and economic momentum. We expect this to raise questions around the Fed’s tolerance for inflation persistence and to increase sensitivity in real rates and the dollar to incoming data, particularly labour market releases. As a result, markets are likely to react not only to the nomination itself, but also to early communication signals during confirmation hearings, where language around inflation risks, independence and the balance between growth and price stability will be scrutinised closely.
A second order, but potentially more powerful, transmission channel is institutional credibility. Any perception that the Fed’s independence could be weakened, whether through rhetoric or pressure around the timing of policy easing, would likely lift term premium even in a slowing growth environment. We expect this combination of softer growth expectations and higher uncertainty premia to keep rates volatility elevated and to underpin demand for safe-haven assets, especially gold. In that sense, the Fed succession is not only a US rates story, but a global cross asset catalyst that could shape the macro regime for much of 2026.
Bonds and FX
2026: disinflation or credibility year?
Bond direction in 2026 is likely to be dictated by whether the macro narrative settles into clean disinflation with a soft landing, or whether inflation risks remain sticky enough to keep policy rates priced higher for longer. We see the risk distribution as asymmetric, given that relatively few cuts are priced, meaning that even a modest deterioration in labour market conditions could trigger a meaningful repricing towards lower policy rates. We expect this tension to define both the level and the shape of curves. In a benign scenario where inflation continues to ease without a sharp growth slowdown, front end yields can grind lower, with labour market data likely to be the key catalyst, but the extent of any rally further out the curve is likely to be capped. By contrast, if inflation proves more persistent, even modestly so, markets are likely to maintain a restrictive policy bias in pricing, keeping real yields elevated and reducing the scope for duration to perform meaningfully.
Major Economies’ 10Y Bond Yields
Global curves enter 2026 from a much higher yield equilibrium.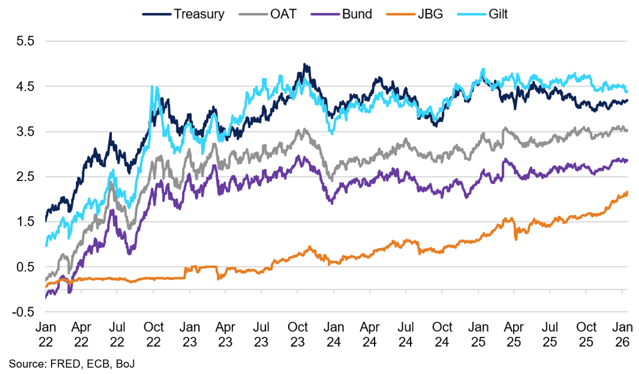
One underappreciated driver we see for 2026 is the inflation impulse linked to the AI capital expenditure cycle. Large scale investment in data centres and related supply chains is inherently energy intensive and can sustain cost pressures even as broader demand cools. We expect this to keep an inflation risk premium embedded in longer dated bonds, particularly in the US. As a result, bond rallies may look more uneven, with the front end responding to policy expectations while the long end remains constrained by inflation tail risks.
For FX, relative policy credibility and hedging flows are likely to matter more than pure growth differentials. If the Fed transition is interpreted as more dovish bias or more tolerant for inflation overshoots, the dollar can weaken even if US data remain resilient, as markets compress the expected real yield advantage. In this scenario, we see scope for gradual USD depreciation rather than a disorderly move, driven by portfolio rebalancing and reduced demand for dollar hedges rather than outright risk aversion.
Conversely, if inflation reaccelerates or if term premium rises due to concerns around policy credibility, we expect the dollar to stabilise quickly through the rates channel. In that environment, higher real yields and renewed carry appeal would act as a natural anchor for the USD, particularly against low yielding currencies. This asymmetry leaves room for USD softness punctuated by sharp but contained rebounds, rather than a clean trend. We also expect the euro to trade more as a macro barometer than a policy story, strengthening when global growth expectations improve and weakening during risk-off episodes, given the lack of a near-term ECB catalyst.
Geopolitics
Is geopolitics now a persistent premium rather than a flashpoint shock?
Russia-Ukraine remains a core 2026 geopolitical driver, with the market impact likely to be determined less by neat resolution timing and more by the credibility of any proposed security guarantees and the management of escalation risk. European officials have been explicit that guarantees must be credible and enforceable, and current allied discussions are increasingly framed around binding commitments that would deter a future Russian attack. At the same time, Ukraine’s leadership reshuffle, including changes at the top of the security services, signals that Kyiv is still adapting its strategy, reinforcing that investors can rapidly reprice geopolitical risk premia around negotiation headlines and battlefield developments rather than allowing them to drift lower over time. For markets, the transmission channels remain energy, European fiscal and defence spending implications, as well as the broader risk sentiment, which can feed into rates volatility and gold hedging demand even when day to day headlines fade.
Geopolitical Risk Index vs WTI
WTI has tended to fade geopolitical risk spikes, reinforcing that the pass-through to energy remains highly event-driven and difficult to sustain.
Venezuela has become a fresh 2026 shock vector after the US operation that captured Nicolás Maduro and brought him to the US to face criminal charges. The key point for oil is sequencing: even if politics shift, near term barrels do not appear instantly, and the path depends heavily on legal permissions and the ability of US operators to re-enter and invest at scale. We view Venezuela’s supply potential as primarily shaped by policy and legal constraints rather than physical capacity, suggesting that its market impact in 2026 lies more in added uncertainty than in immediate supply growth.
On Taiwan, we see Venezuela as a scenario risk rather than a direct trigger, but one that markets are increasingly conscious of. The issue is not a mechanical link between events in Latin America and the Taiwan Strait, but the way such actions may subtly shape perceptions of US focus and strategic posture, which can influence risk calculations at the margin.
That said, the linkage should not be overstated. Taiwan occupies a fundamentally different place in China’s strategic framework and developments elsewhere do not automatically translate into higher near-term risk in East Asia. Our view is that the more relevant market signal is broader in nature, namely that great power competition is becoming more operational and less constrained, which tends to keep a higher geopolitical risk premium embedded across energy, FX and rates even without a single defining flashpoint.
The AI Story
Can the physical system keep up with AI valuations in 2026?
AI in 2026 is likely to be less about model breakthroughs and more about whether the physical system can support the expectations already embedded in equity valuations. We see a growing gap between the market’s implied pace of AI monetisation and the real-world constraints of the necessary infrastructure. That chasm matters because investors increasingly need to look beyond earnings delivery and assess whether data centre build-out and supporting energy infrastructure can keep pace with expectations. The push to secure generation is already visible, with US power sector deals explicitly framed around data centre and AI driven demand.
The scale of required investment remains striking, with AI related capital expenditure expected to approach 500 billion dollars in 2026. This spend is no longer concentrated solely on chips and servers, but increasingly on power generation and transmission upgrades as electricity availability has become a binding constraint in many major data centre hubs. Power availability, rather than compute demand, is becoming the binding constraint, suggesting that the pace of AI deployment is increasingly determined by infrastructure delivery rather than technological capability.
S&P Information Index vs S&P 500
Information-heavy equities have continued to outperform the broader S&P 500, reflecting AI optimism outpacing the rest of the market.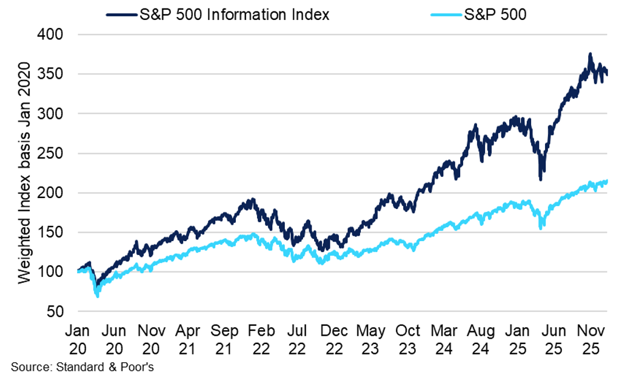
We expect the energy channel to be one of the clearest macro linkages in 2026. The IEA projects global data centre electricity consumption is set to more than double by 2030 to around 945 TWh, with AI as the most important driver of that growth. In the near term, AI’s capital and energy intensive build out sits uneasily alongside the longer term productivity story, keeping some inflation risk priced and challenging the idea of a clean disinflation path. We see this as one reason long end rates may remain sensitive to term premia and supply even if growth moderates, and why the equity story increasingly depends on who can secure power and capacity, not just who has the best models.
For markets, 2026 is likely to mark a shift away from indiscriminate AI exposure towards greater differentiation, with increasing attention on companies that benefit from AI indirectly through infrastructure and deployment. We expect investors to focus more on the infrastructure stack, power, grid equipment, data centre developers, cooling, networks and the firms that can contract capacity reliably, because they determine the speed limit of AI deployment. At the same time, we see rising political and community friction around data centre expansion, which can slow project timelines and raise costs, adding execution risk to the most optimistic growth assumptions. In practice, that means AI can continue to support equities, but the market will increasingly price the difference between companies that can convert demand into delivered compute and cash flow, and those whose valuations assume a scale up that the infrastructure pipeline cannot yet guarantee.
How Much Does AI Actually Matter for Copper and Aluminium?
Copper and aluminium are increasingly discussed as essential metals in the AI-driven transition. Data centres, grid connections, and power generation all rely on these metals for critical construction. According to the IEA, building AI centres typically takes 2–3 years, but upgrading the supporting energy infrastructure often takes even longer and may become a bottleneck. Cables have lead times of 2–3 years, large transformers up to 4 years, and some HVDC cables can take more than 5 years to deliver.
This indicates that, while the AI narrative is genuine, it remains in its early stages. The pace of expansion is largely governed by the availability of grid interconnections and cable supplies, which will ultimately determine the timing of actual metal demand. S&P Global projects copper demand for data centres to rise from 1.1Mt to 2.5Mt by 2040. Although AI and data centres represent a meaningful structural trend, the incremental demand over the next 1–2 years remains modest compared to the overall market size.
That said, incremental demand can be significant - particularly for copper, which is expected to move into a structural deficit later this decade, resulting in an increasingly tight market. However, for 2026, we anticipate a surplus in refined copper of 50,000 tonnes before a deficit of 150,000 tonnes emerges in 2027. This implies that, although the market is fragile and sensitive to demand surges or supply disruptions, current prices appear to be driven more by speculation than by underlying fundamentals.
We see fundamental value for copper in a base-case scenario (factoring in fundamentals and modest scarcity) at $10,500–11,500/t, with a tariff risk premium of $500–1,000/t. As a result, we view prices above $11,500–12,000/t as currently unjustified. While the AI narrative underpins the medium-term price floor, we believe it is not sufficient to explain the recent upward momentum.
Base and Precious Metals Outlook
What keeps the precious metals rally going in 2026?
After a powerful 2025, we see the 2026 outlook for precious metals shifting away from a debate dominated by speculation and liquidity towards a more nuanced assessment of sustainability, in particular the role of carry and incremental capital flows. The core macro drivers remain real yields and geopolitical risk premia, but we expect market structure to play a more prominent role as prices consolidate at elevated levels. Gold’s medium-term support looks most durable if real yields fail to rise materially, either because easing expectations persist or because term premia reflect uncertainty rather than underlying growth strength. In this environment, gold continues to function as a hedge against policy risk and geopolitical uncertainty rather than as a pure inflation or growth trade.
Silver ETF Holdings vs Spot Silver
ETF holdings have climbed with spot, highlighting that the move has drawn in real allocation, not just leverage.
Heading into 2026, the rally in both gold and silver has been driven primarily by speculative positioning, with recent gains taking place amid constrained market liquidity. Positioning expanded materially during the advance, particularly in silver, contributing to elevated volatility and more unstable price action. We see this as a source of vulnerability, as thin liquidity amplifies both upside extensions and downside corrections, increasing sensitivity to shifts in real yields and broader risk sentiment.
That said, the rally has not been purely speculative. Ongoing hedging demand and strategic allocation interest have provided an underlying bid even during periods of poor market depth, helping explain why pullbacks have so far struggled to gain traction. Market structure remains supportive, especially in silver, where backwardation keeps carry costs low and, at times, positive, with lending returns still available. This reduces the likelihood of a prolonged drawdown and suggests that, while corrections may be sharp, they are more likely to be tactical than trend-defining unless accompanied by a sustained tightening in financial conditions.
The key question for 2026 is therefore not whether precious metals have already moved a long way, but whether sufficient incremental capital can absorb volatility and extend the move. We see this primarily as a function of macro confidence and policy credibility rather than positioning alone. The main downside risk would arise if US real yields reprice higher alongside a strengthening dollar, forcing a more aggressive de-leveraging across the complex. In such a scenario, silver would likely underperform gold due to its higher volatility and greater sensitivity to growth expectations, reinforcing its role as gold plus cyclicality rather than a standalone safe haven.
Is Speculation Driving Base Metals Toward Liquidity Risks?
A systematic-led rally in base metals, led by copper, is creating flow distortions in the market, increasing the pockets in liquidity and nonlinear price moves. With copper prices at historically elevated levels, there is little or no hedging activity, removing much of the natural selling pressure from the market and leaving speculative players largely in control.
Holding copper at the LME has become relatively expensive, and with moderate backwardation, there have been notable withdrawals from the exchange, reducing the physical availability of copper. Flows are increasingly directed to COMEX, as repeated tariff fears drive material to the US. This raises concerns that current momentum is driven more by speculative flows than by robust fundamentals, making current price support fragile and vulnerable to narrative shifts, especially if global risk-off sentiment takes hold.
As a result, price discovery is now dominated by CTAs and macro funds, which further deplete liquidity without replacing it, perpetuating a cycle where thinning liquidity and bullish narratives drive prices higher, with profit-taking as the only meaningful source of selling. Higher funding costs and tighter risk limits also reduce market-making activity. We are watching closely for signs of momentum crowding, which typically leads to short, but healthy, corrections.
Premium between LME and CME Copper
While the premium between two exchanges remains subdued, there is continued interest to ship copper to the US.
This systematic flow is further evidenced by recent moves across both base and precious metals. The 30-day correlation between silver and copper is now at 90%, while the gold-copper correlation stands at 60%. These synchronized moves are not rooted in metal-specific fundamentals, resulting in heightened volatility and unpredictability, increasingly driven by macroeconomic news. As a result, any bout of risk-off sentiment could trigger sharp declines across all metals, not just a single segment.
Key metrics we watch out for:
- Nearby spreads tightening into significant backwardation.
- Sudden withdrawal of stocks on the LME
- Exchange margin hikes, which could lead to funding stress.
- Macro shocks: equity corrections, USD spike, growth scare.
- Tariff news: sudden announcements of tariffs or flare-ups of trade disputes with China.
What Mining Risks Threaten Copper in 2026?
The mine shutdown at Grasberg in October has shifted the perception of a fragile copper market surplus into a deficit. With nearly 3.6% of global production now being taken out from Grasberg, our current projections stand at 50,000 tonnes of surplus this year. While this shortage may be partially offset by an increase in scrap supply, the fragility of this balance suggests that copper is more prone to short-term squeezes, especially on any other announcements of disruptions. As a result, any additional demand or supply disruption now triggers pronounced volatility in forward prices and spreads, as the market recalibrates its outlook.
While major outages in other mines remain difficult to predict, the risk of continued chronic disruptions is expected to persist into 2026, driven by sustained underinvestment in mines and declining ore quality over recent years. These factors further reinforce a solid floor under copper prices.
Top 5 Copper Mines Globally
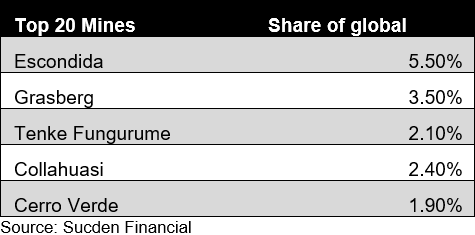
In particular, Teck has reduced its production guidance for Quebrada Blanca (QB) through 2028 due to tailings disposal challenges, with 2026 output expectations notably lowered. This type of prolonged supply shortfall can keep the market tighter than initially anticipated. Collahuasi is also underperforming, hampered by lower ore grades, reduced recoveries, and water scarcity, while Anglo American has warned that its 2026 output may fall short of previous guidance.
With structural factors supporting copper, we expect that any reversal in speculative flows this year will not result in a significant price collapse, with the $10,500/t level likely to act as a strong support. However, this still represents a $2,500/t gap from current levels - a move that could materialise rapidly if speculative positions are unwound.
Will US Copper Tariffs Return in 2026?
Persistent concerns that the US could reimpose copper tariffs in 2026 have prompted accelerated shipments to COMEX, effectively locking material within the US and tightening regional supply. In early 2025, President Donald Trump’s tariff threats sparked a rush to ship copper to the US. When refined metal was later exempted from tariffs, this trade paused but revived recently as renewed fears of tariffs pushed local inventories to new highs. As a result, US copper imports in December surged to their highest level since July.
Trump has tasked the Department of Commerce with delivering an update on the US copper market by the end of June, when a decision on refined metal tariffs is expected. The department previously proposed a 15% levy starting in 2027, increasing to 30% in 2028, but as of June 2026, the White House is yet to confirm a final deadline.
In the meantime, uncertainty is already distorting trade flows: a persistent CME-LME premium is drawing physical copper into the US, depleting other sources, including China’s bonded stocks, and fracturing global trading patterns. We anticipate that throughout the first half of 2026, these fears will continue to drain material from other regions, resulting in confusing market signals, regional price premiums, and pockets of illiquidity.
Japan Outlook
Could Japan become the new macro anchor in 2026?
Japan enters 2026 in a very different position from the one that defined the past decade. The Bank of Japan is now on a measured normalisation path, with policy rates back in positive territory and balance sheet support slowly receding, while inflation sits near target and wage gains are firmer than before the pandemic. The process is gradual, but it signals the end of Japan’s long deflationary era and points to a more durable policy framework going forward.
EUR/JPY vs USD/JPY
Despite normalisation, the yen weakened as rate differentials stayed wide.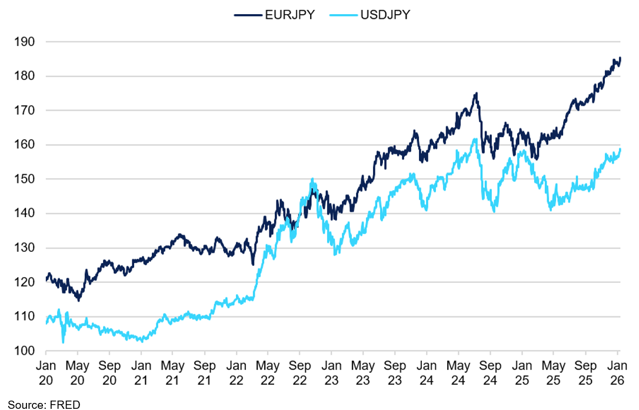
Japan’s shift matters for global markets because it changes how money moves. Positive yields on JGBs make it more appealing for Japanese investors to keep funds at home, or even repatriate capital, and that can push global long-end yields higher even if growth stays steady. The result is a world where curves remain responsive to policy credibility and supply, with Japan providing a new anchor rather than simply absorbing volatility.
For FX, the implications are two-sided. Higher domestic yields and continued policy normalisation favour a stronger yen over the medium term, especially if the Fed leans towards easing. However, the currency’s role as a preferred funding source is not disappearing quickly, and periods of global risk aversion can still generate sharp moves as carry trades are unwound and investors shift between the dollar and the yen for safe-haven protection. We see Japan moving from a passive backdrop to an active macro driver in 2026, with BoJ communication and wage outcomes playing a key role in how investors position across FX and rates.
China Outlook
What's the Growth and Stimulus Outlook for 2026?
In 2025, China met its “around 5%” growth target through resilient goods exports and a large fiscal impulse. Looking ahead, consensus expects growth to moderate rather than fall in 2026, but that outcome depends on the state maintaining a steady pace of support. Indeed, in 2025, China leaned on an unusually large fiscal package, including record special treasury bond issuance and expanded local-government bond quotas. Maintaining this pace will require similar investment levels going forward. From the monetary policy perspective, the PBoC eased in mid-2025 via policy-rate cuts, an RRR cut, and lower benchmark lending rates.
The key risk is that the growth mix becomes more imbalanced over time. China’s trade surplus reached $1tr by November, underscoring how much growth is leaning on external demand. With limited scope to counter protectionism, and persistent imbalances with Europe and Mexico, exports are likely to face stronger headwinds in 2026. The US-China trade truce lasts until November 2026, but renewed trade tensions remain a material risk.
That external drag raises the bar for domestic demand to carry more of the load. However, with limited scope for broad monetary easing, the policy burden shifts toward fiscal tools. As a result, China has pledged to broaden fiscal spending in 2026, signalling continued government support amid external headwinds. The emphasis on advanced manufacturing, tech innovation, and human capital reflects a deliberate pivot: fiscal policy is being used not just to smooth the cycle, but to steer the direction of growth.
This fiscal pivot sits within a broader strategic framework. China’s 15th Five-Year Plan, set for finalisation in March 2026, will cover 2026–2030 and positions technology as the primary growth engine. For the first time, it also ties economic security more explicitly to growth objectives. China aims for per capita GDP to reach “moderately developed” status and still targets doubling the economy from 2020 to 2035, implying a continued emphasis on ~4-5% annual growth through this decade.
Regulating Stablecoins
Are stablecoins about to go mainstream?
Crypto and stablecoins are becoming less about speculation and more about financial plumbing, and we expect that shift to accelerate in 2026 as the US and UK move from consultation into implementation. In the US, the GENIUS Act has become the main reference point for policymakers, and the debate has moved past whether stablecoins should be regulated to how strict the rules should be on reserves, issuance, redemption and business models. In the UK, we see a similar transition underway. The FCA has set out the initial framework for stablecoins and followed with detailed consultation on issuance and custody, while flagging stablecoin payments as a priority for 2026, including a regulatory sandbox to allow controlled testing. We see this as a key turning point because the shape of the final rules will decide whether stablecoins remain a parallel system or start to plug directly into mainstream payments and treasury functions.
Stablecoin USD HQLA Reserves (millions of $)
USDT and USDC reserves have continued to expand, reinforcing their shift from speculative asset to mainstream payments.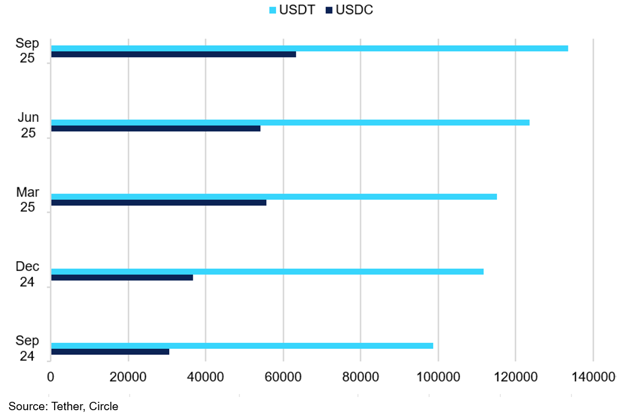
We expect that tighter reserve requirements, especially for dollar-linked products backed by cash and short-dated Treasuries in the US, and high-quality assets under the UK’s “qualifying stablecoin” regime, together with clearer redemption rights, would improve confidence in stablecoins as settlement instruments. In that scenario, stablecoin growth could create a steady marginal bid for front-end Treasury bills in the US, nudging money markets and short-maturity demand at the margin, even if not enough to dominate pricing. In the UK, the link to payments is even more explicit, with responsibility split between the FCA for issuance and custody and the Bank of England for sterling stablecoins that may become systemically important.
A key open question is whether issuers should be allowed to offer rewards or yield to holders. Regulators are likely to stay cautious on both sides of the Atlantic, given the risk that stablecoins begin to resemble bank liabilities without the same safeguards. This matters for how quickly adoption grows and where the regulatory perimeter ultimately lands. Institutional design is also relevant: the UK is consolidating payments oversight, with the Payment Systems Regulator’s functions set to move into the FCA, which could speed up the practical integration of stablecoins into the wider payments agenda.
For FX markets, the bigger picture is that well-regulated, dollar-linked stablecoins can extend the dollar’s reach in cross-border payments, even during periods when the USD weakens on macro grounds. We see this as reinforcing the dollar’s global role through infrastructure rather than rate differentials alone. In practice, that means demand for dollar settlement and dollar liquidity could remain resilient even if the currency softens cyclically. For the UK, the macro relevance is less about sterling’s international role and more about whether regulated GBP stablecoin rails improve domestic payments efficiency and allow UK financial institutions to participate in digital asset infrastructure without importing US regulatory risk - something we expect to matter for London’s competitiveness over time.

