


EUR / USD
Source: Massive (polygon.io)
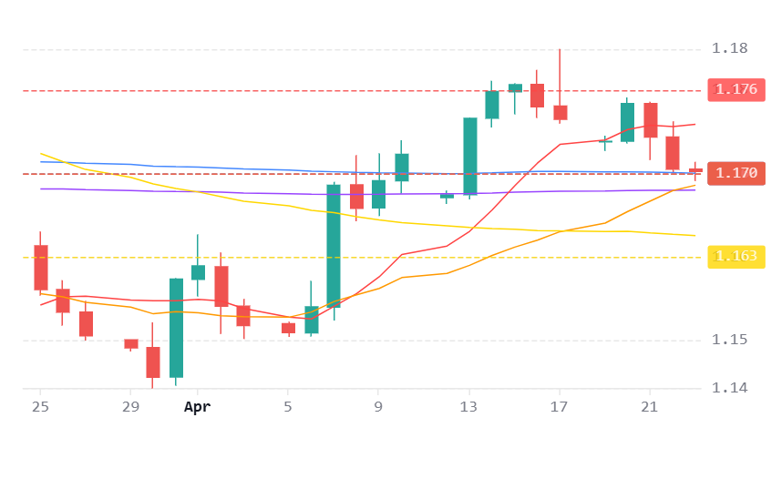
The EUR/USD pair is under notable pressure, declining approximately 0.4% over the past 24 hours to trade near 1.1700, as the complex interplay of geopolitical risk, energy market disruption, and monetary policy divergence continues to favour the dollar. The effective closure of the Strait of Hormuz remains the dominant macro catalyst, with persistent Iranian threats to commercial shipping keeping Brent crude near $100 per barrel despite the announced ceasefire extension, creating acute headwinds for the energy dependent euro area economy. German ZEW investor sentiment has fallen to -17.2, its weakest level since December 2022, while warnings of jet fuel supply constraints heading into the summer tourism season further darken the euro area growth outlook.
The monetary policy setting structurally favours the greenback, as the ECB finds itself caught in a stagflationary bind where elevated energy driven inflation limits its ability to cut rates even as economic momentum deteriorates. The Fed, by contrast, benefits from United States energy self sufficiency and retains greater policy flexibility, reinforcing the asymmetry that is drawing capital towards the dollar.
From a technical perspective, the pair is now testing a dense cluster of support around the 200 day moving average near 1.1700, with an RSI reading of 52 reflecting neutral momentum and leaving the directional outcome finely balanced. Flash PMI data due Thursday for France, Germany, and the broader euro area will be critical in determining whether this support holds and prompts a move towards the mid April high near 1.1835, or whether downside surprises accelerate a bearish move towards the March low around 1.1415.
USD / JPY
The USD/JPY pair is trading in a structurally bullish environment, advancing to approximately 159.60 and sitting above all key moving averages, with the 20 day SMA at 159.19 and the 50 day SMA at 159 providing layered support. Japan’s acute vulnerability to the ongoing Strait of Hormuz disruptions remains the dominant fundamental driver of yen weakness, as the country’s near total reliance on energy imports forces persistent dollar purchases on the open market, widening the trade deficit and mechanically pressuring the currency regardless of broader dollar index movements.
The monetary policy setting further reinforces the bearish yen bias, with roughly 80 percent of economists now expecting the Bank of Japan to hold rates steady at its upcoming April meeting, a marked dovish shift from March, while the Federal Reserve is similarly expected to hold, preserving the wide interest rate differential that structurally favours the dollar. The BoJ’s reluctance to tighten reflects the reality that Japan’s current inflation is overwhelmingly cost push from energy rather than demand pull, meaning rate rises would risk destabilising the recovery without addressing the root cause of price pressures.
Resistance stands at the late March high near 160.40, less than one percent higher and close to the psychologically significant 160 level where verbal intervention from Japanese officials historically intensifies, though the marginal effectiveness of such warnings appears to be declining against the weight of fundamentals. A decisive break above 160.40 on continued dollar strength or rising United States yields could open a path towards the 162 all time high, while a reversal would likely require either a hawkish BoJ surprise or meaningful diplomatic progress on the Iran situation to relieve energy cost pressures. The sequence of BoJ and Fed policy decisions over the next two weeks, alongside Japan’s March CPI release and developments around the Hormuz blockade, represents the key catalysts that will determine whether the pair breaks to new highs or retreats towards the 159 support zone.
GBP / USD
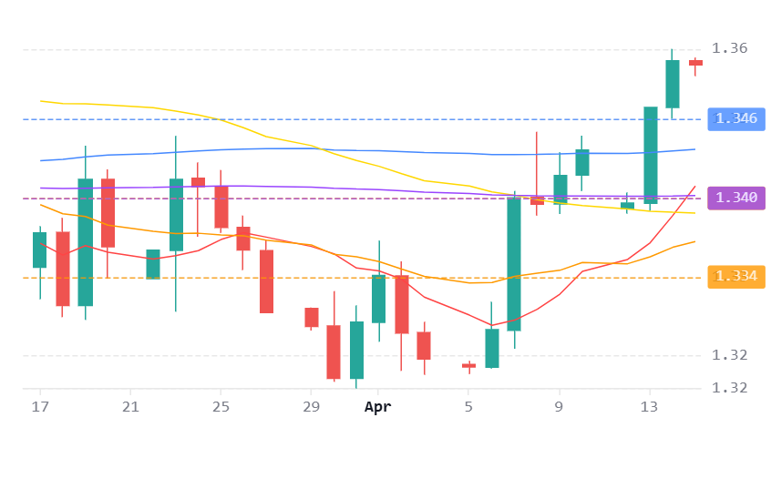
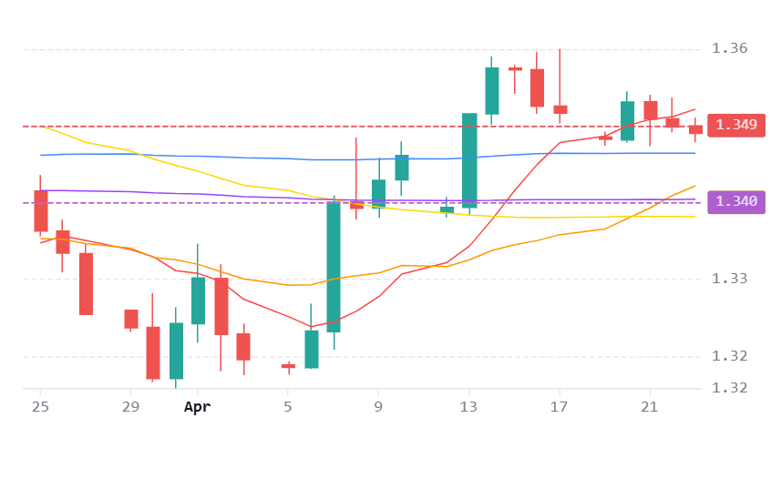
Source: Massive (polygon.io)
GBP/USD is consolidating after its recent rally, drifting lower to around 1.3488 as the pair navigates a complex macro environment shaped by divergent central bank paths and persistent geopolitical headwinds from the United States Iran conflict. The technical picture shows the pair trading well above the support cluster near 1.3400, where the 200 day, 50 day, and 20 day simple moving averages converge alongside the 30 day rolling VWAP, while the daily RSI at approximately 55 signals modestly positive momentum without overextension. A defence of the 1.3480 area could reignite a move towards the 1.3587 resistance, whereas a break below that level risks accelerating selling towards the 1.3400 support zone.
On the fundamental side, the Bank of England faces a difficult balancing act as United Kingdom headline inflation rose to 3.3% year on year in March, driven largely by energy costs linked to the Middle East crisis and Brent crude near $100 per barrel, while core CPI unexpectedly eased to 3.1%, keeping markets firmly positioned for a rate hold at 3.75% on 30 April. This cautious BoE stance contrasts with the structurally supported United States dollar, underpinned by strong retail sales growth of 1.7% month on month and resilient consumer spending, alongside moderately hawkish signals from incoming Fed Chair Kevin Warsh during his confirmation hearing.
Near term direction will hinge on Thursday’s United Kingdom flash PMI estimates and Friday’s retail sales data, which will be critical in shaping monetary policy expectations and determining whether sterling can mount a meaningful recovery. Unless United Kingdom data delivers a convincing upside surprise, the fundamental and technical setting suggests constrained sterling upside against a dollar that retains broad structural support.


