EUR / USD
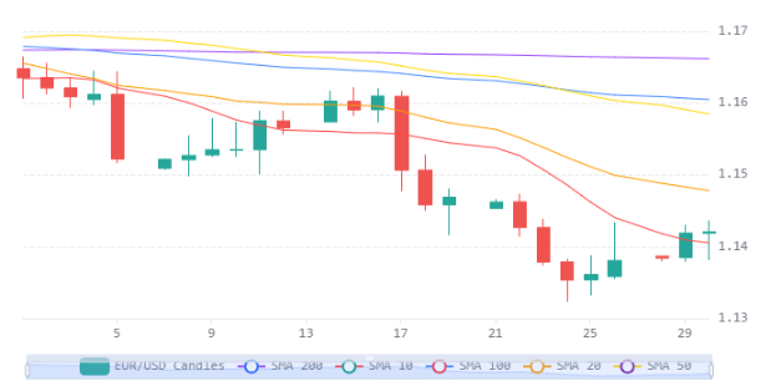
Source: Massive (polygon.io)
The EUR/USD pair remains under fundamental bearish pressure as Q2 2026 concludes, trading near 1.1423 and firmly below all major moving averages—including the 200-day at 1.1658, the 50-day at 1.1606, and the 20-day at 1.1494—confirming a structurally negative technical alignment with RSI hovering around 39. The dominant driver remains the widening monetary policy divergence between the Federal Reserve, holding rates at 3.5-3.75% with a potential September hike, and the ECB, which is signalling a more cautious path as eurozone inflation softens and preliminary PMI surveys show contraction in France and Germany.
The fundamental backdrop strongly favours the dollar, as three consecutive months of above-consensus US job gains reinforce the hawkish Fed narrative while German inflation fell sharply to 2.3% year-over-year, reducing urgency for further ECB tightening. Major Wall Street banks have closed bullish euro positions at quarter-end, reflecting a structural conviction shift rather than a tactical adjustment, and the dollar index has posted gains in both Q1 and Q2 supported by higher Treasury yields and safe-haven demand.
Near-term price action shows support at the 1.1400 level, with failure to hold re-exposing the multi-month low near 1.1329, while any sustained break above 1.1437 could trigger short-covering toward 1.15. Critical catalysts this week—including the ECB Sintra Forum panel featuring Lagarde and Fed Chair Warsh on Wednesday, followed by US nonfarm payrolls on Thursday—have the potential to amplify or challenge the current bearish trajectory. Until either US data materially disappoints or the ECB signals renewed hawkishness, the path of least resistance for EUR/USD remains to the downside.
USD / JPY
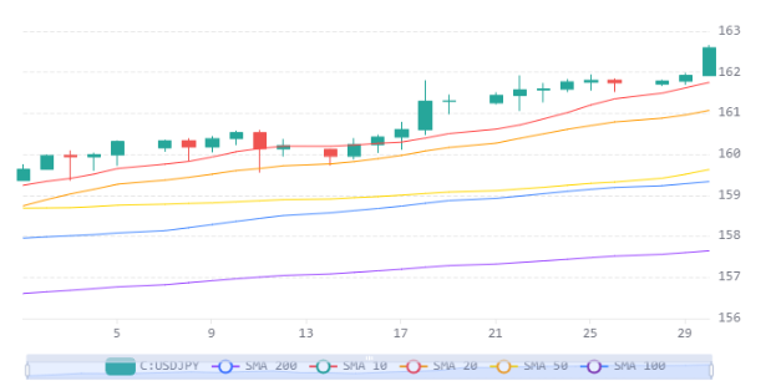
Source: Massive (polygon.io)
USD/JPY continues its relentless advance, printing a fresh all-time high near 162.67 as the pair trades approximately 190 pips above the 20-day SMA and 500 pips above the 200-day SMA, reflecting a powerfully extended trend driven by the persistent 250–275 basis point interest rate differential between the Federal Reserve at 3.50%–3.75% and the Bank of Japan at 1.0%. The carry trade remains the dominant structural force, with investors borrowing cheaply in yen to deploy into higher-yielding dollar assets, while market expectations of further Fed tightening—with roughly 63% probability priced for a September hike—continue to widen the yield gap and sustain capital outflows from Japan.
Japan's record $72.25 billion intervention campaign between late April and May has fully dissipated in its effects, and analysts now view the 163–165 zone as the next likely intervention trigger rather than the recently breached 162 level, suggesting authorities have limited tools to arrest the decline absent a fundamental shift in monetary policy. Structural headwinds including Japan's heavy energy import dependence amid elevated oil and LNG costs from geopolitical tensions, Prime Minister Takaichi's expansionary fiscal agenda, and the country's demographic constraints further erode yen confidence and limit the scope for aggressive BOJ tightening.
From a technical perspective, the daily RSI at 81.4 signals deeply overbought conditions that raise the probability of a corrective pullback toward the 20-day SMA near 161 or structural support at 161.20, though genuine institutional participation confirmed by volume patterns suggests the trend retains underlying momentum. Thursday's US nonfarm payrolls report represents the key near-term catalyst, as a strong reading would reinforce hawkish Fed expectations and potentially propel the pair above 163, while a disappointing print could provide the backdrop for profit-taking at these extreme levels. The fundamental outlook remains tilted toward continued yen weakness with forecasts targeting 164, though the Bank of Japan's July 31 decision and any escalation in intervention rhetoric at these multi-decade highs represent the primary risks to the bullish trajectory.
GBP / USD
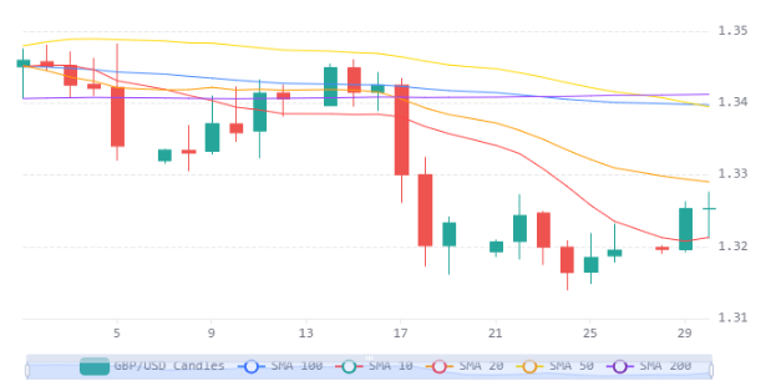
Source: Massive (polygon.io)
The GBP/USD pair remains under pressure, trading around 1.3260 and situated well below a cluster of key resistance levels including the 200-day SMA at 1.34, the 50-day SMA at 1.3420, confirming that the multi-month downtrend from the January peak near 1.3850 remains intact. The dominant macro headwind driving this weakness is monetary policy divergence: the Federal Reserve's hawkish posture under Chair Warsh—with markets now pricing a potential rate hike by year-end—stands in stark contrast to the Bank of England's cautiously steady stance at 5.25%, where inflation concerns at 3.2% prevent easing but offer no upside catalyst for sterling.
On the fundamental side, the UK's Q1 GDP growth of 0.6% appeared solid on a quarterly basis but the annual revision down to 0.9% from 1.1% represents a meaningful disappointment, while robust US labour data—including JOLTS openings surprising to the upside at 7.59 million—reinforces the dollar's yield advantage. The broader risk environment also favours dollar strength, with geopolitical uncertainty from the Iran conflict and elevated oil prices dampening global risk appetite.
From a technical perspective, the pair's inability to reclaim the 1.33 moving average cluster leaves it vulnerable to renewed selling pressure targeting last week's low near 1.3147, while only a sustained break above 1.33 would signal a meaningful shift in the bearish structure. The combination of US economic resilience, Fed hawkishness, and the pound's lack of a clear positive catalyst suggests the path of least resistance for GBP/USD remains to the downside in the near term.
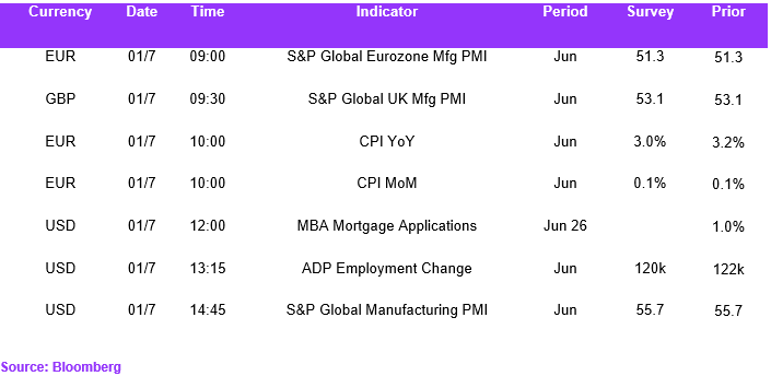
Economic Calendar