


EUR / USD
Source: Massive (polygon.io)
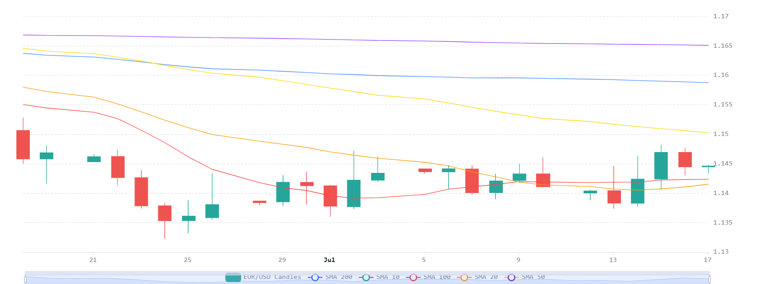
EUR/USD remains caught between diverging monetary policy expectations and escalating geopolitical risks, with the pair easing around 0.2% to trade near 1.1445 as the dollar recovered on resilient US economic data, including stronger than expected labour market figures. Softer June CPI and PPI data have reduced expectations of an immediate Federal Reserve rate increase, but several Fed officials continue to signal that further tightening remains possible. Markets still price around 27 basis points of additional tightening by year end, which continues to underpin the dollar's yield advantage.
The euro continues to face a more challenging macro backdrop. We see the ECB remaining on hold at next week's meeting, while elevated energy costs continue to complicate the outlook. Natural gas prices have risen sharply this year, inventories remain relatively low, and higher oil prices linked to the US Iran conflict continue to weigh disproportionately on the eurozone as a major energy importer. At the same time, eurozone growth expectations have been revised down to just 0.5% for 2026, limiting the scope for further ECB tightening despite persistent inflation pressures.
From a technical perspective, the daily RSI has recovered to around 50 after previously reaching oversold territory, suggesting downside momentum has eased. However, the pair remains below both the 50 day SMA at 1.1500 and the 200 day SMA at 1.1600, leaving the broader trend tilted to the downside. We expect the late June low at 1.1329 to remain the key support level, while sustained gains above 1.1500 would be needed to improve the medium term outlook.
USD / JPY
Source: Massive (polygon.io)
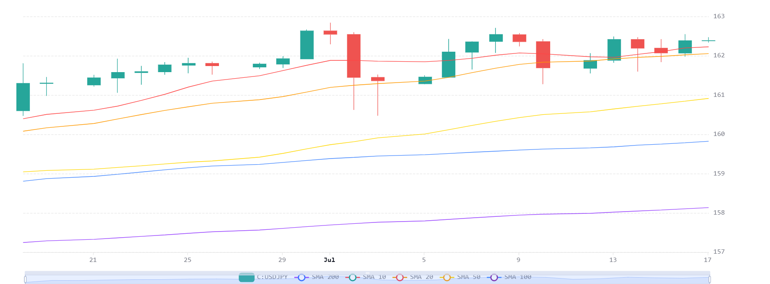
USD/JPY continues to consolidate near multi decade highs around 162.38, with the pair remaining firmly supported above the 20 day SMA at 162.05, the 50 day SMA at 160.91 and the 200 day SMA at 158.13. Although the daily RSI has eased to around 60, indicating that momentum has moderated, the broader technical structure remains constructive.
The principal driver continues to be the wide interest rate differential between the United States and Japan. Rising US Treasury yields and expectations that the Federal Reserve will keep policy restrictive continue to support the dollar, while the Bank of Japan remains constrained in the pace of policy normalisation. Recent political debate surrounding the Bank's independence has reinforced concerns that further tightening will remain gradual, limiting support for the yen.
We continue to see the 162.50 to 162.80 region as the key resistance area. A sustained break above this zone could open the way towards 163.00 and beyond, while failure to clear resistance may encourage profit taking towards initial support around 162.05 and the broader support area near 161.00. Intervention risk also remains elevated given the yen's proximity to multi decade lows.
GBP / USD
Source: Massive (polygon.io)
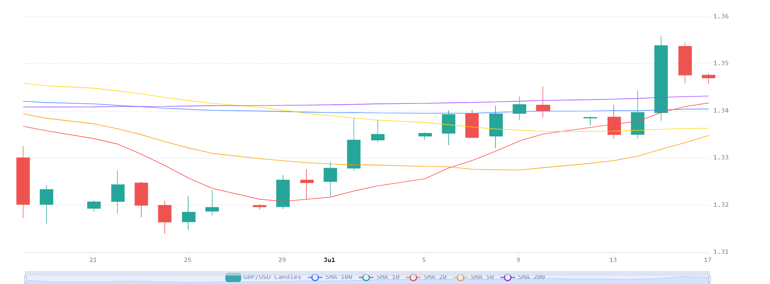
GBP/USD has eased around 0.5% to trade near 1.3469, although the pair remains within a broader constructive trend after reaching its highest level in almost two months earlier this week. Sterling continues to benefit from improving domestic sentiment following recent political developments, while expectations of a Bank of England rate increase by November continue to provide underlying support.
The US dollar has nevertheless regained some ground as resilient labour market data and continued hawkish commentary from Federal Reserve officials have reinforced expectations that US policy will remain restrictive. We also see renewed geopolitical tensions in the Middle East adding another layer of support for the dollar through safe haven demand, while higher energy prices pose a greater challenge for the UK as a net energy importer.
Technically, GBP/USD remains above its 20 day, 50 day and 200 day SMAs clustered around the 1.3300 to 1.3400 region, preserving the broader positive structure despite the recent pullback. The daily RSI near 60 suggests momentum remains supportive rather than overstretched. We expect the 1.3450 to 1.3460 area to act as an important near term support zone. A sustained hold above this region could allow another test of 1.3540, while a break lower would increase the risk of a deeper correction towards the 50 day SMA near 1.3400.

