


EUR / USD
Source: Massive (polygon.io)
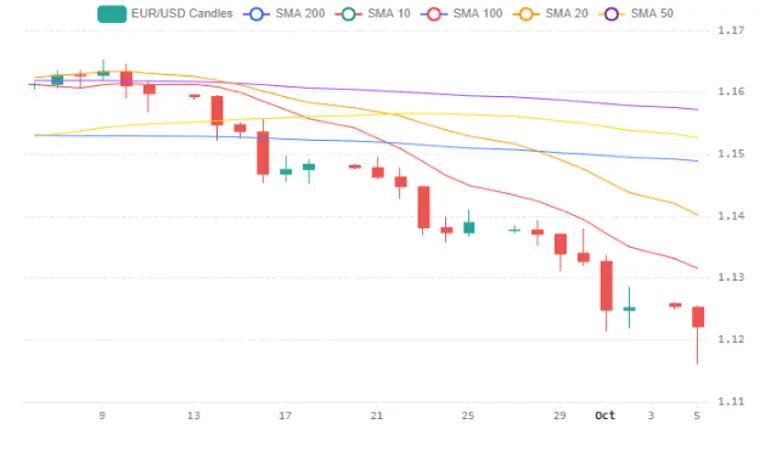
The EUR/USD pair remains under pressure, having plunged nearly 0.9% on Monday to a low near 1.1163 before partially recovering to approximately 1.1221. This sharp selloff is rooted in a deepening fiscal crisis in France, where the debt-to-GDP ratio has climbed to nearly 118–120% and the spread between French and German 10-year bond yields surged to approximately 160 basis points — the widest since the 2011 eurozone sovereign debt crisis. Political instability, including the prospect of Marine Le Pen's National Rally gaining power in France and Spain's snap election call, is compounding investor anxiety and raising fears of broader contagion to other heavily indebted eurozone economies such as Italy and Belgium.
From a technical standpoint, the pair now trades deeply below all key moving averages — the 200-day SMA at 1.16, the 50-day SMA at 1.15, and the 20-day SMA at 1.14 — confirming an entrenched bearish trend with losses exceeding 3.8% over the past month. The daily RSI near 16 reflects extremely oversold conditions, and heavy volume clustering around the 1.1207 level during the European and early New York sessions suggests institutional participation in the rebound attempt from the lows.
On the US side, the dollar is drawing strength from elevated Treasury yields, persistent inflation signals including a jump in the ISM services prices-paid index to a four-year high, and safe-haven demand amid global bond market turmoil. The ECB faces an extraordinarily difficult position, as further rate hikes to combat 3.8% eurozone inflation risk exacerbating France's borrowing costs, while a weaker euro itself imports additional inflation through higher dollar-denominated commodity prices. This stark policy divergence — a hawkish Fed trajectory against a constrained ECB — combined with eurozone fiscal fragility and deeply bearish technicals, creates a macro environment that strongly favours continued dollar strength, though the extreme oversold readings leave the door open for a short-term mean-reversion bounce toward the 1.14 area before the broader downtrend reasserts itself.
USD / JPY
Source: Massive (polygon.io)
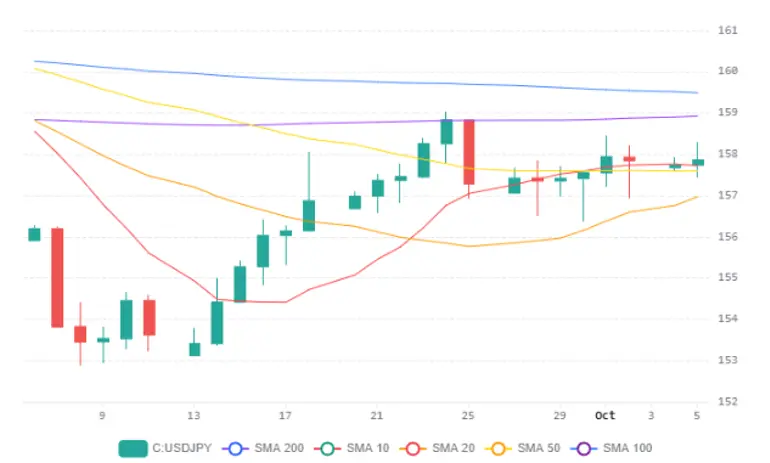
The USD/JPY pair is trading near 157.88, caught between competing forces as the roughly 225–250 basis point interest rate differential between the Federal Reserve (3.50%–3.75%) and the Bank of Japan (1.25%) continues to structurally underpin dollar strength through the carry trade dynamic. However, sharply cooling U.S. labour data — September nonfarm payrolls at just 29,000 versus 90,000 expected, with unemployment rising to 4.2% — have reduced the probability of further Fed tightening, with futures markets pricing an approximately 80% chance the Fed holds steady at its late-October meeting. Counterbalancing this dovish signal, the ISM services prices-paid sub-index surging to a four-year high and 10-year U.S. Treasury yields near 5.28% continue to provide a floor for the dollar.
On the Japanese side, the BoJ's policy trajectory is the critical variable, with Governor Ueda's upcoming remarks set to be scrutinized for signals of a back-to-back rate hike at the October 30 meeting, even as Japan's composite PMI fell to its weakest level since May, potentially arguing against immediate further tightening. Safe-haven flows into the dollar, amplified by European political turmoil, have pushed the dollar index to 18-month highs and reinforced the greenback's broader appeal against the yen.
Technically, the pair remains below both the 200-day SMA around 159 and the 50-day SMA at 158, confirming a broader bearish structure since the July highs near 164, though the daily RSI at 55 indicates modest upward momentum building since the September lows around 153. A decisive break above the 158–159 moving average confluence would signal a shift toward renewed dollar strength, while rejection at that zone risks dragging the pair back toward the 30-day VWAP at 156.53 and potentially the established support near 153.
GBP / USD
Source: Massive (polygon.io)
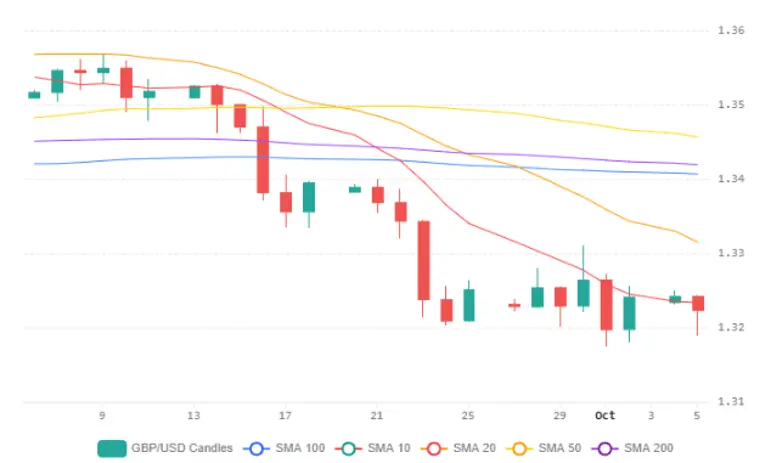
GBP/USD is trading under persistent bearish pressure near 1.3225, well below its key moving averages — the 50-day SMA at 1.3500, the 200-day SMA at 1.3400, and the 20-day SMA at 1.3300 — with the daily RSI around 36 confirming sustained downside momentum following a roughly 3% decline over the past month. The pair found near-term support at approximately 1.3189, where buyers stepped in, but the confluence of declining moving averages overhead continues to cap meaningful recovery attempts.
From a macro perspective, the dollar retains structural support from elevated U.S. Treasury yields, with the 10-year reaching approximately 5.31% — its highest since 2002 — driven by accelerating input costs, heavy sovereign borrowing, and lingering inflation pressures that reinforce demand for dollar-denominated assets. However, the collapse in the Federal Reserve's October rate hike probability from 71% to 24%, following a sharply disappointing nonfarm payrolls report of just 29,000 jobs, has removed a key near-term pillar of dollar strength and could provide sterling some breathing room.
Sterling draws support from Bank of England signals that further tightening is likely, with markets pricing in a November rate hike, alongside better-than-expected UK growth of 0.5% in the second quarter and a shift in institutional sentiment as capital rotates toward the pound as a European alternative. Nevertheless, uncertainty surrounding the upcoming UK budget and elevated oil prices above $100 per barrel — adding inflationary risk to both economies — mean that a decisive break below the 1.3192 support could open the path toward the three-month trough near 1.3147, while any dovish surprise from U.S. data or hawkish BoE follow-through would be needed to reclaim the 1.3300 level.
Economic Calendar


