


EUR / USD
Source: Massive (polygon.io)
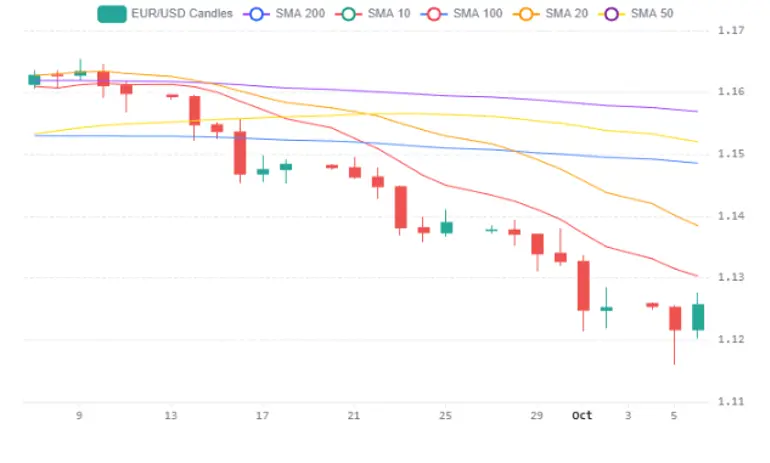
The EUR/USD pair remains under significant pressure, trading near its lowest levels in over a year as a confluence of eurozone fiscal stress and persistent US dollar strength drives the multi-month downtrend. The pair's 3.6% decline over the past month — from a January peak near 1.2040 to a close around 1.1259 — reflects deep fundamental headwinds, with the daily RSI languishing near 26 in deeply oversold territory. A dense cluster of overhead resistance at the 20-day SMA (1.14), 50-day SMA (1.15), and 200-day SMA (1.16) underscores the magnitude of the technical damage and the challenge facing any sustained recovery.
On the euro side, escalating fiscal concerns in France remain a primary drag, with the French-German 10-year bond spread above 150 basis points at levels not seen since the 2011 sovereign debt crisis, while political instability — including Spain's snap election — compounds investor unease about the region's governance. Lower French yields have helped the euro recover towards 1.125, but this looks more like temporary stabilisation than a turn in the underlying trend, with the OAT–Bund spread still the key measure of contagion risk. The ECB also faces a policy trap: eurozone inflation at 3.8% theoretically supports further tightening, yet hawkish action risks deepening France's fiscal stress. Meanwhile, deteriorating economic fundamentals — exemplified by German factory orders plunging over 10% month-on-month — further erode the euro's footing.
The US dollar continues to benefit from elevated Treasury yields near multi-decade highs, supported by robust services-sector data and persistent inflation concerns that keep expectations alive for further Fed tightening in December. The latest easing in the 10-year yield below 5.30%, alongside a wider US trade deficit, has allowed DXY to soften towards 101.8, but persistent services inflation and high yields leave the dollar's broader support intact. Attention now turns to the Fed minutes and the $39bn 10-year Treasury auction: firm demand could cap yields and extend the euro's near-term rebound, although any sustained recovery would still require a more meaningful decline in US yields or credible eurozone fiscal consolidation. Until then, the path of least resistance remains tilted towards a test of 1.1100.
USD / JPY
Source: Massive (polygon.io)
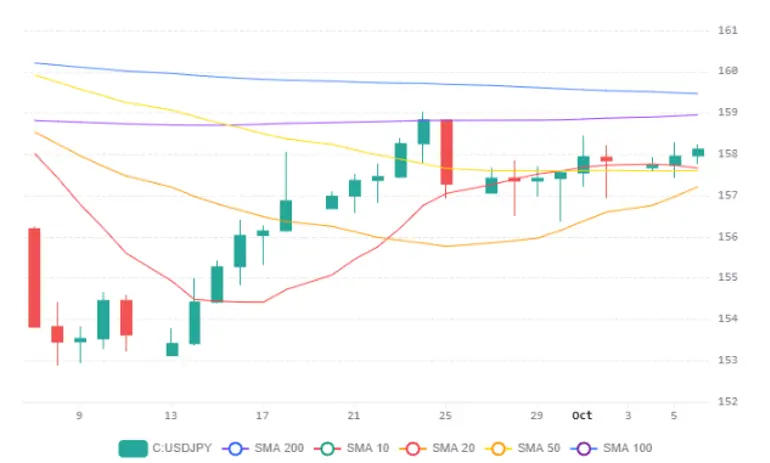
USD/JPY is trading near 158.15, caught between divergent monetary policy paths as the Federal Reserve holds rates elevated while the Bank of Japan signals continued normalization. The pair has edged modestly higher over the past 24 hours, consolidating tightly between the 50-day SMA at approximately 158 and the 200-day SMA near 159, with an RSI of 57 reflecting gradually building bullish momentum following September's recovery from the 153 lows.
The U.S.-Japan yield differential remains the dominant structural driver, as U.S. 10-year yields above 5.25% continue to provide a meaningful carry advantage over Japanese government bonds despite JGB yields surging to multi-decade highs around 3.14% on the 10-year. The latest easing in Treasury yields has tempered dollar upside, while markets now assign only a 21% probability to an October Fed increase following weak payroll growth and downward revisions to earlier employment figures. However, a December increase remains largely priced in, and hawkish Fed commentary on tariffs, AI-related spending, and elevated energy costs has prevented a wholesale repricing lower in U.S. rates. On the Japanese side, Governor Ueda's reiterated commitment to raising rates and potential signalling that inflation has broadly reached 2% reinforce expectations for a December BOJ hike, though the preference among many policymakers to hold steady in October limits near-term yen support.
From a technical perspective, a bullish resolution would see the pair clear resistance at 158.50 and target the 200-day SMA around 159, with potential extension toward the psychologically significant 160 level, while failure at the 200-day average could trigger a pullback toward the 20-day SMA at 157 and VWAP support near 156. Geopolitical headwinds — including crude oil near $100 amid U.S.-Iran tensions and Japan's fiscal expansion plans under PM Takaichi — add complexity by sustaining global inflationary pressures while complicating the BOJ's tightening calculus, keeping the pair range-bound until a decisive shift in the yield differential materializes.
GBP / USD
Source: Massive (polygon.io)
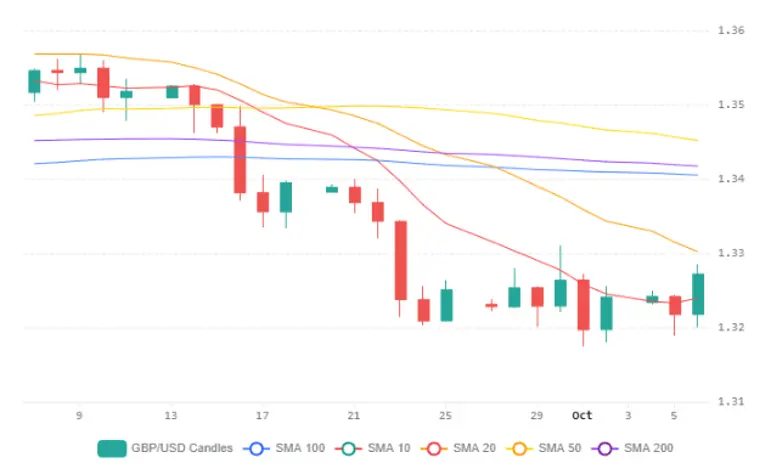
GBP/USD gained roughly 0.4% over the past session, climbing from 1.3218 to close around 1.3271, yet this recovery does little to alter the persistent bearish structure that has driven the pair down nearly 3% over the past month. The current price remains firmly below a key resistance cluster formed by the 20-day SMA at 1.33, the 200-day SMA at 1.34, and the 50-day SMA at 1.35, suggesting that any rallies continue to face formidable technical headwinds.
From a fundamental perspective, the pair is caught between divergent central bank expectations: the Bank of England appears poised for further tightening, with markets pricing roughly 100 basis points of cumulative hikes by year-end following hawkish warnings from MPC member Catherine Mann about embedded UK inflation reaching 4%. The latest easing in Treasury yields and oil prices has given sterling some room to recover, while a wider US trade deficit has helped DXY soften towards 101.8. However, persistent US services inflation and Treasury yields still near multi-decade highs continue to underpin the dollar, limiting sterling's ability to capitalise on its own hawkish narrative.
A critical near-term risk for the pound lies in the upcoming UK budget on October 28, with at least one major investment bank warning that sterling is underpricing fiscal risk and recommending positioning for weakness. Technically, the pair needs to defend the 1.3184 support level and push convincingly through the 20-day SMA at 1.33 to trigger meaningful short-covering, while failure at that resistance likely reopens the path toward the June trough near 1.3147, particularly if the Fed's September meeting minutes deliver any hawkish surprises.

