


EUR / USD
Source: Massive (polygon.io)
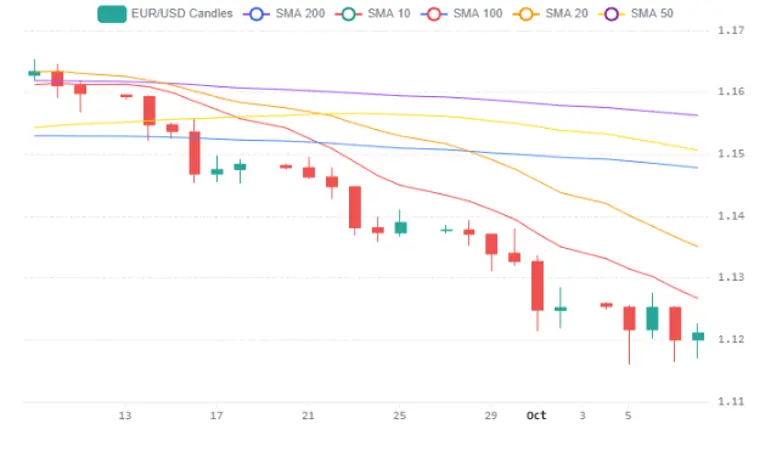
The EUR/USD pair remains under intense bearish pressure, trading around 1.1211 after briefly touching a one-year low of 1.1166 earlier in the week, as a powerful combination of dollar strength and euro-specific weakness keeps the pair pinned well below all major moving averages. The daily RSI sits deeply oversold near 24, with price nearly 4% lower over the past month and trading beneath the 20-day SMA at 1.1400, the 50-day SMA at 1.1500, and the 200-day SMA at 1.1600, underscoring the severity of the prevailing downtrend.
On the dollar side, the fundamental backdrop remains firmly supportive. The Federal Reserve's September minutes revealed most policymakers anticipate another rate hike before year-end, with hawkish commentary from Governor Waller and St. Louis Fed President Musalem reinforcing that stance, while weekly jobless claims falling to a 2.5-month low of 197,000 give the Fed little reason to relent. U.S. Treasury yields near multi-decade highs — the 10-year around 5.23% and the 30-year briefly touching 5.73% — continue to bolster the dollar's commanding yield advantage over European peers.
The euro faces compounding headwinds from France's fiscal crisis, where the OAT-Bund spread has blown past 140 basis points amid deep market scepticism about deficit reduction from 5.4% of GDP, with the ECB explicitly ruling out intervention to suppress French borrowing costs. Deteriorating European fundamentals — including declining German exports and persistent energy cost pressures from Brent crude above $104 — further erode the single currency's appeal, as rising European yields have failed to attract support given investors' focus on growth fragility over rate differentials. Looking ahead, a failure to sustain gains above 1.1200 risks a retest and break below the 1.1166 floor, while only a decisive reclamation of the 1.1230 area could trigger a short-covering rally toward the 1.1400 zone where the oversold RSI may invite mean-reversion buyers.
USD / JPY
Source: Massive (polygon.io)
The USD/JPY pair is caught between powerful structural forces, with the wide U.S.-Japan interest rate differential continuing to underpin the dollar while nascent shifts in Bank of Japan policy introduce meaningful two-way risk. U.S. Treasury yields have surged above 5.3% on the 10-year — levels not seen since 2002 — supported by a hawkish Federal Reserve and resilient labour data, including jobless claims falling to a 2.5-month low of 197,000. On the Japanese side, the BOJ has upgraded its regional economic assessment and a previously dovish board member now supports gradual tightening from the current 1.25% policy rate, though markets price only an 11% probability of a hike at the October 30 meeting, limiting near-term yen support.
Japan's structural vulnerabilities further weigh on the currency, with corporate bankruptcies at a 13-year high, a record fiscal spending request of approximately $918 billion, and heavy energy import dependence exposed by crude oil surging past $100 per barrel. These headwinds, combined with expansionary fiscal measures such as consumption tax cuts on food, complicate any path toward sustained yen appreciation despite improving domestic sentiment.
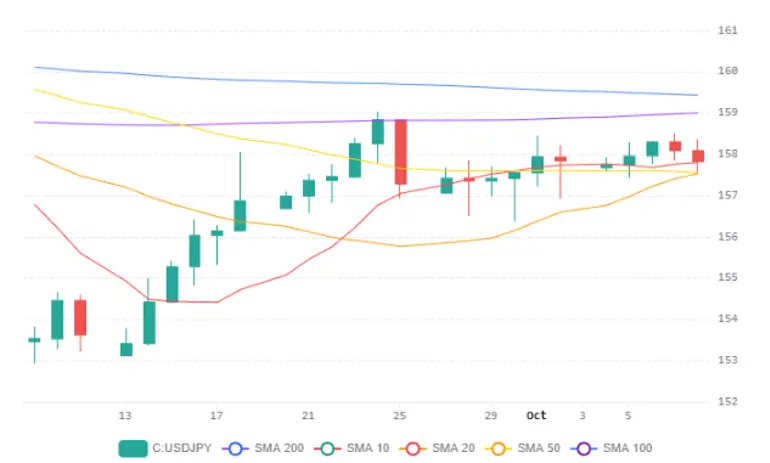
From a technical standpoint, USD/JPY closed near 157.83 after a sharp intraday selloff on heavy volume, and now sits just above the converging 20-day and 50-day simple moving averages near 157.55 — a critical confluence zone — while the 200-day SMA at approximately 159 represents significant overhead resistance. The pair's near-term trajectory will hinge on whether this moving average support holds amid the interplay of persistently elevated U.S. yields, evolving BOJ normalization expectations, and potential Japanese intervention risk, with a break below 157.55 opening a path toward the 156.50 VWAP region while a sustained bid above could target the 159 level.
GBP / USD
Source: Massive (polygon.io)
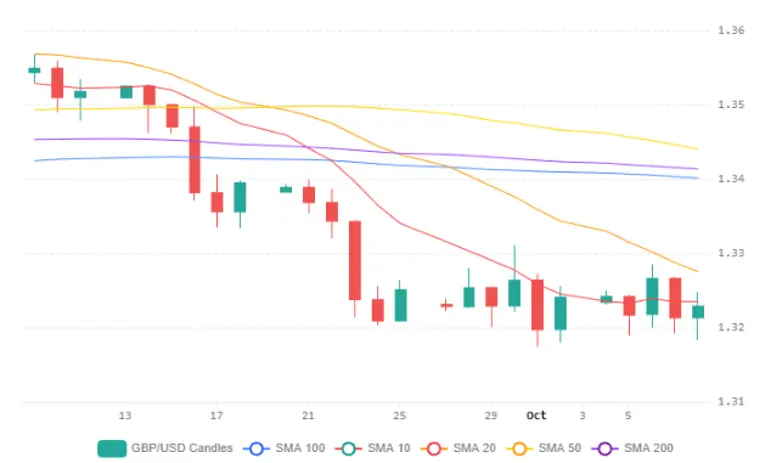
GBP/USD is trading within a narrow range around 1.3228, remaining firmly below all major moving averages — with the 200-day and 50-day SMAs clustered near 1.34, and the 20-day SMA at 1.33 — underscoring persistent bearish pressure from the broader downtrend off the January highs near 1.3848. The daily RSI at approximately 40 indicates the pair is drifting toward oversold territory without yet reaching extreme levels, while nearby support at 1.3185 was tested twice during the session and held.
The macro backdrop is dominated by divergent central bank expectations, with the Fed maintaining a hawkish posture — markets pricing roughly 83% odds of a December hike to 4.00%–4.25% — while the Bank of England also faces strong expectations of a November rate increase, with money markets assigning greater than 80% probability of Bank Rate rising to 4.00%. Elevated US Treasury yields, with the 10-year approaching 5.35% before settling near 5.23%, alongside surging oil prices driven by geopolitical tensions, continue to favour broad dollar strength and weigh on GBP/USD.
A bullish case requires a break above the 1.33 moving average cluster, potentially targeting resistance near 1.3332, should upcoming UK data surprise to the upside or BoE rhetoric from Governor Bailey and policymaker Lombardelli cement November tightening expectations. However, a decisive breach below 1.3185 support would expose the multi-month low near 1.3147, particularly if persistent dollar momentum and rising global bond yields continue to dominate the macro landscape.
Economic Calendar


