


Summary
As we enter the second half of Q2 2025, markets remain tethered to the evolving trade narrative, with Trump’s tariff strategy continuing to dominate global macro sentiment. While the initial shock of the 2 April tariff announcement has subsided, policy inconsistency and the 90-day delay on implementation have kept investors on edge. With trade talks between the US and China entering a critical phase, headline-driven volatility is expected to persist through May and June.
The ripple effects are visible across regions. In the US, uncertainty over trade policy direction has eroded investor confidence and triggered pressure on the dollar. China, meanwhile, is responding with targeted stimulus, choosing patience over concession as it waits for American consumers to absorb the pain of higher import costs. Europe has shown rare cohesion in its response, preparing a €100 billion countermeasure while simultaneously seeking a negotiated solution. Together, these developments reflect a broader shift towards fragmentation in global trade—undermining long-term investment confidence and reinforcing near-term market fragility.
For the metals complex, the near-term outlook remains rangebound. While tariffs on base metals other than aluminium and steel remain off the table for now, the 90-day pause ends in early July—keeping policy risk firmly in play. Investor positioning remains short-dated, with volatility exacerbated by low conviction and headline sensitivity. A weaker dollar offers some support, but persistent demand concerns—particularly in China—are likely to cap upside. As ever, copper remains the bellwether, with the COMEX/LME arbitrage a key indicator to watch for shifts in trend momentum.
Watch our Q2 2025 Metals Market Webinar
Aluminium
Aluminium prices are expected to mirror copper trends, but gains are capped due to oversupply in alumina and rising Chinese production. This is expected to contribute to a bigger surplus in China’s domestic market. While US tariffs on aluminium have minimal impact on China, they affect trade dynamics, particularly with Canada, the largest supplier to the US. We expect aluminium prices to track copper with modest gains but constrained by persistent supply challenges and evolving trade relationships.
Copper
LME copper prices are heavily influenced by existing divergence with COMEX amid tariff speculations. While we do not expect copper tariffs to be implemented in the near term, overall headline risk persists. China’s copper exports have surged as they diversify their market away from the US to other destinations. We expect copper to stay within the $9,200–9,500/t range, with the cost of production support at $8,700/t holding firm over the long term.
Lead
Lead mirrored the broader market performance, dropping below the $2,000/t mark, as demand concerns grew more prominent. With the lead-acid battery off-season ending, lead prices may recover back above this level, supported by renewed demand. However, the long-term outlook is less constructive, with growing oversupply and waning demand, prompted by auto tariffs and continued transition towards EVs, weighing on lead’s price prospects. Our Q2 2025 outlook remains cautious, with resistance expected around $2,100/t despite near-term recovery signs.
Nickel
Nickel prices remain capped at $15,000–$16,000/t in Q2 2025, as structural oversupply and weak Chinese demand outweigh intermittent bullish headlines. Elevated Indonesian output, soft stainless and battery sector demand, and high LME inventories continue to limit upside, with any rallies likely short-lived and sentiment-driven.
Tin
Tin remains volatile in the $30,000–$34,000/t range in Q2 2025, supported by strong semiconductor demand and fragile supply conditions. With Myanmar’s Man Maw mine still offline, ongoing risks in Central Africa, and falling exchange inventories, the market remains sensitive to disruptions despite Indonesia’s temporary export strength.
Zinc
Zinc has underperformed in the LME base metals complex, declining over 14% since January. Unlike copper, zinc attracts fewer speculative investors and is currently facing an impending oversupply cycle, as indicated by rising treatment charges recovering from their lows. Although downside risks appear contained for now, a sustained break above $2,700/t would be a key signal for a broader recovery in zinc through the remainder of the quarter.
Iron Ore
Iron ore prices continued to decline in 2025 due to rising supply and weakening demand, with concerns exacerbated by high Chinese steel output and trade tensions. The reinstatement of a 25% tariff on steel imports led to a sharp rise in domestic steel prices without reviving iron ore demand. Despite the ongoing challenges China faces, both internally and externally, we expect iron ore prices to remain above $90/mt, supported by production cost floors.
Gold
Gold surged to record highs in April, driven by trade policy volatility, rising inflation expectations, and dollar weakness. Investor positioning remains bullish, with strong ETF inflows and elevated net longs providing structural support. Heading into Q2, gold will likely stay well-supported amid safe-haven demand and persistent policy uncertainty.
Silver
Silver remains rangebound in Q2 2025, underperforming gold despite structural market deficits and resilient physical demand. Weak investor appetite, cautious industrial outlooks, and macroeconomic uncertainty continue to weigh on sentiment, keeping prices capped even as longer-term fundamentals remain supportive.
Platinum
Platinum remains well-supported entering mid-Q2 2025, driven by robust automotive sector demand, persistent supply constraints in South Africa, and stabilising investor sentiment. Amid ongoing substitution from palladium and tightening fundamentals, prices appear poised to test higher levels near $1,000–$1,030/oz.
Palladium
Palladium faces a challenging outlook in Q2 2025, weighed down by eroding auto sector demand, rising supply from major producers, and ongoing investor scepticism. With substitution by platinum largely complete and no near-term supply constraints, the market risks sliding deeper into surplus. Prices are likely to remain capped, with downside risks prevailing.
Macroeconomic Outlook
Global Economy
As we move into mid-Q2 2025, the global economy continues to face elevated levels of uncertainty, driven by the United States’ increasingly protectionist stance under President Trump. On 2 April, known as “Liberation Day”, the administration unveiled sweeping tariffs, including a baseline 10% levy on all imports and higher rates on goods from 57 countries. Although many of these measures have since been postponed for 90 days, the initial announcement disrupted global trade flows and rattled financial markets.
In response, the International Monetary Fund (IMF) has downgraded its global growth forecast for 2025 to 2.8%, down from a previous estimate of 3.3%. The US economy is now expected to grow by just 1.8% this year, a sharp revision from the earlier 2.7% forecast—the largest downgrade among advanced economies. China’s outlook has also been lowered to 4.0%, reflecting the fallout from trade tensions, reduced access to US markets, and growing uncertainty over investment flows. The Eurozone, though less directly targeted, has seen its growth forecast trimmed to 1.0% as it absorbs the secondary effects of global trade fragmentation. A potential increase in diverted Chinese exports to Europe could also reinforce disinflationary trends within the bloc.
International Monetary Fund Cuts to 2025 GDP
The IMF has downgraded its global growth forecast for 2025 to 2.8%, down from a previous estimate of 3.3%
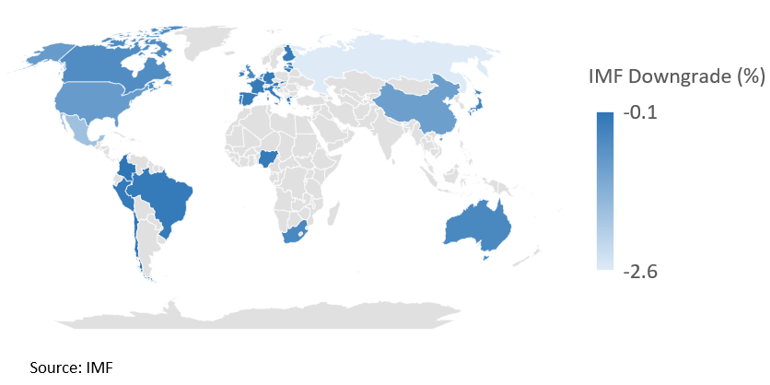
These developments highlight a broader shift towards economic fragmentation, as countries adjust to a more inward-looking US trade policy. With market volatility elevated and global supply chains under pressure, the next few months will be critical in shaping the trajectory of the world economy.
Oil
Oil prices have come under renewed pressure in early May, with both Brent and WTI falling to four-year lows, trading near $61.63/bbl and $58.64/bbl, respectively. This decline is driven by rising OPEC+ supply, softer demand forecasts, and ongoing uncertainty surrounding global trade policy.
On the supply side, OPEC+ has increased production by nearly 1m bbl/day between April and June, led by Saudi Arabia’s move to pre-emptively meet expected summer demand. While aimed at addressing low inventories, the decision has fuelled concerns over a potential oversupply if demand disappoints. The market reaction has been cautious, with prices responding more to macro-driven sentiment than to underlying fundamentals.
On the demand side, conditions have softened. The International Energy Agency (IEA) recently revised its 2025 global oil demand growth forecast down to 730,000bbl/day, citing the impact of trade tensions and broader economic headwinds. Nevertheless, near-term consumption appears resilient, with refiners—particularly along the US Gulf Coast—benefiting from strong margins, indicating that throughput remains robust for now.
In the US, falling prices are starting to weigh on the industry. Several shale producers have cut capital expenditure and scaled back drilling activity, warning that output could decline if prices remain below breakeven levels. Industry leaders are increasingly questioning whether US onshore production has already peaked—an idea that would have seemed implausible only months ago.
Looking ahead to May and June, the outlook remains finely balanced. Trade negotiations, particularly between the US and China, may sway sentiment, while any shift in OPEC+ strategy could either cushion or exacerbate price volatility. Until greater clarity emerges, oil is likely to trade within its current range, driven more by headlines than fundamentals. In this environment, volatility—rather than direction—may define the market through early summer.
US
The US economy enters mid-Q2 2025 under growing scrutiny as investors reassess the country’s role in the global financial system. While President Trump's protectionist platform was a known variable, the scale and disorganisation of the tariff rollout has introduced a deeper layer of uncertainty. The 2 April tariff package—initially announced as a blanket 10% levy on all imports with higher rates on select countries—has since been partially delayed, amended, and reinterpreted in ways that suggest policy is being made on the fly. This has not only disrupted global trade flows but also undermined confidence in the reliability of US economic policy.
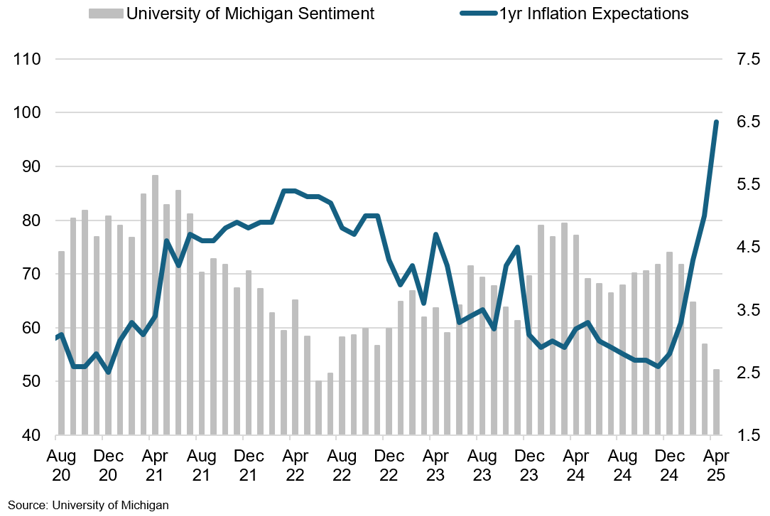
University of michigan confidence vs 1-year inflation expectations
Inflation expectations surged to 6.5% in April, the highest level since 1981.
Investor sentiment has deteriorated accordingly. Institutional investors are beginning to reduce exposure to US assets amid concerns over political unpredictability, policy fragmentation, and broader geopolitical decoupling. In a clear break from historical norms, recent weeks have seen coordinated selling pressure across Treasuries, the dollar, and US equities—raising questions about the dollar’s long-assumed safe-haven status. The dollar index dropped below 100 for the first time since 2022, reinforcing the view that this is not merely a technical correction. Rather, the dollar may be entering a structurally weaker phase as global capital increasingly looks for alternatives.
Domestically, the US economy remains relatively solid, but the policy backdrop is growing more fragile. Job creation remains positive, and consumption is holding up—thanks in part to a still-resilient labour market and easing financial conditions. However, cracks are beginning to emerge. Consumer sentiment surveys dipped in April, and forward-looking indicators, including the ISM manufacturing and services indices, have softened. Inflation remains sticky in the services sector, while disinflation persists in goods—leaving the Federal Reserve facing a complicated policy landscape.
Against this backdrop, the Fed opted to hold interest rates steady at 4.25%–4.50% at its latest meeting, reflecting a cautious stance in light of mounting macroeconomic uncertainty. Chair Jerome Powell noted that the full effects of the new tariffs have yet to filter through to economic data and warned of simultaneous risks to both inflation and employment. With stagflation concerns rising, the central bank is maintaining a wait-and-see approach, signalling that any further moves will be closely tied to incoming data—particularly developments in labour markets and price pressures. The Fed remains prepared to adjust its stance as conditions evolve, but for now is reluctant to act without clearer visibility.
Looking ahead to May and June, the US macro story will likely continue to be shaped by efforts to bring greater clarity to trade policy. The recent agreement between the US and China to reduce reciprocal tariffs to a baseline 10% for a 90-day periods has alleviated some trade-related uncertainties, leading to a rebound in investor confidence and a strengthening of the US dollar. However, the temporary nature of the tariff reduction means that markets remain vigilant. While the immediate risk of a deeper correction in US asset prices has diminished, the sustainability of this positive momentum will largely depend on the progression of trade relations and domestic economic performance in the coming months.
China
As of mid-Q2 2025, China is recalibrating its economic strategy in response to a volatile global environment shaped by domestic pressures and recent breakthroughs in trade relations with the US. After months of escalating tariff tensions, a deal was reached on 12 May to reduce reciprocal duties to a baseline 10% for a provisional 90-day period. The agreement marks a critical de-escalation, but not resolution, of a broader strategic rift. For China, it offers temporary breathing room without compromising its core economic priorities, including access to key export markets and protection of domestic industrial policy.
China's Trade
Chinese exports surged in March as manufacturers front-loaded shipments ahead of anticipated US tariffs.

The trade reprieve comes at a sensitive time for China’s economy, with growth slowing under the strain of trade disruptions and subdued global demand. In response, the PBOC cut its benchmark seven-day reverse repo rate by 10bps to 1.4% and lowered the reserve requirement ratio by 0.5 percentage points, effective 15 May—injecting an estimated 1 trillion yuan (US$138 billion) into the financial system. Alongside this broad easing, authorities have introduced targeted support, including low-cost relending for key sectors such as technology and services, mortgage relief for first-time buyers, and an expanded equity market investment quota for insurers totalling 60 billion yuan—all aimed at reinforcing financial stability and investor confidence.
Despite these interventions, China is not positioning itself as a passive player in trade diplomacy. Its negotiating posture remains assertive, rooted in the belief that economic resilience is as much about strategic autonomy as it is about GDP figures. The May agreement with the US reflects a tactical willingness to de-escalate, but Chinese officials have signalled that long-term concessions are unlikely unless Washington shifts towards a more stable and reciprocal policy framework.
Looking ahead to the remainder of Q2, China’s trajectory will hinge on two fronts: the effectiveness of its domestic stimulus measures and the durability of the newly brokered trade truce. If talks falter or the tariff rollback proves short-lived, downside risks could quickly resurface. For now, however, Beijing appears focused on consolidating internal stability while allowing time to test whether American policy will evolve from disruption to dialogue.
Eurozone
What began as a transatlantic trade disagreement is fast becoming a defining test of European resolve. As Washington escalates its tariff threats, the Eurozone is no longer merely reacting; it is repositioning. With President Trump’s administration imposing a 10 percent baseline tariff on EU imports and warning of a potential rise to 20 percent if negotiations break down, Brussels has drawn its own line. A €100 billion retaliatory package targeting key US exports, including Boeing aircraft and agricultural goods, is now prepared to launch if no breakthrough is reached by mid-July.
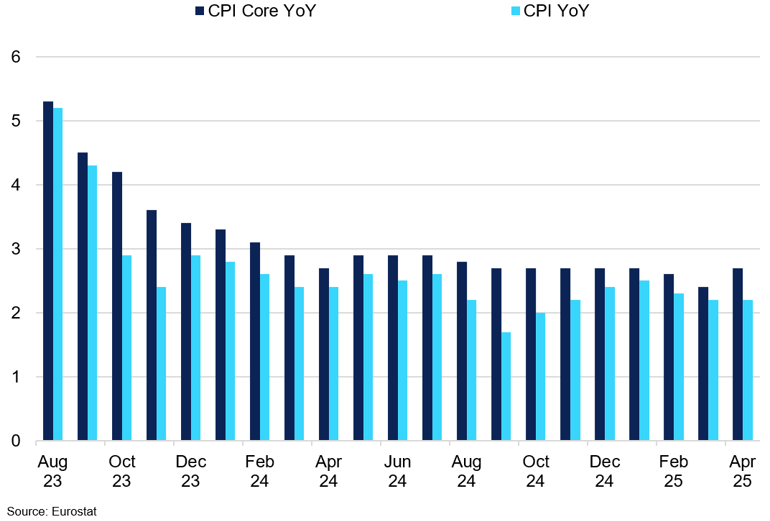
Eurozone Headline vs Core CPI
In April 2025, Eurozone annual inflation held steady at 2.2% YoY.
Despite the rising tensions, the Eurozone economy posted a stronger-than-expected performance in Q1 2025, with GDP expanding by 0.4 percent quarter-on-quarter. This marked the fifth consecutive quarter of growth and was, in part, fuelled by front-loaded exports to the US as European firms moved swiftly to get ahead of the tariff deadlines. Yet this momentum may not be sustained. With trade barriers now in effect and domestic demand still lacklustre, the coming quarters could see renewed pressure on both industrial output and consumer confidence.
The ripple effects of the trade dispute have extended swiftly into financial markets. The Stoxx Europe 600 shed its early-year gains in the days following the tariff announcements, as investors reassessed earnings prospects in an increasingly protectionist world. Export-heavy sectors, especially automotive and banking, bore the brunt of the repricing. Adding to the pressure, the euro has climbed more than 9% against the dollar since January, undercutting the competitiveness of European goods just as transatlantic trade frictions deepen.
In the weeks ahead, the Eurozone’s economic direction will be shaped not just by macroeconomic fundamentals, but by the outcome of a high-stakes diplomatic balancing act. If trade negotiations with the US collapse, the activation of Brussels’ €100 billion retaliatory tariff package could chill growth and unsettle markets. If diplomacy prevails, however, some of the current pressures may ease, offering a reprieve to exporters and investors alike. For now, the EU’s coordinated stance offers a measure of stability, buying time as it navigates both external pressure and internal economic fragility.
Key Drivers for Q2 2025
- Tariff unpredictability has made it difficult to hold longer-term positions, prompting investors to focus on short-term strategies instead — which has only amplified short-term volatility.
- We expect tariffs directly targeting base metals to remain limited, at least until July, when the current 90-day tariff pause ends. However, market sentiment remains vulnerable to headline risk, keeping the overall volatility elevated.
- Even if copper tariffs materialise, potential exemptions for major exporters such as Chile, Canada, and Mexico would shield around 80-90% of US copper imports, significantly limiting any fundamental impact.
- In the meantime, the COMEX/LME arb is a key metric to monitor, with copper setting the tone for the rest of the complex.
- Overall, we expect prices to remain within current ranges in the coming months, with occasional volatility spikes following trade announcements. A weaker dollar provides some support, but demand concerns will probably keep a lid on any significant upside.
Aluminium
Key Points
- Aluminium prices should mirror copper trends, but gains are capped by oversupply in alumina and rising Chinese production.
- US tariffs have limited impact on China, which is redirecting aluminium exports, especially to Russia.
- US aluminium supply remains reliant on Canada, making trade relations under USMCA crucial to monitor.
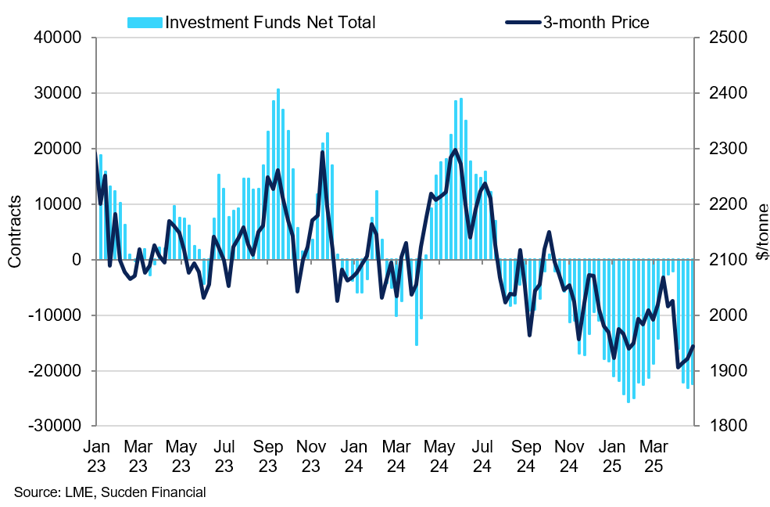
Aluminium started this year on a positive note, gaining moderate momentum and testing the $2,700/t resistance level, where it encountered strong selling pressure. On March 12th, the Trump administration raised tariff rates on aluminium products from 10% to 25% on imports from all countries under Section 232. Leading up to the implementation date, regional aluminium premiums – such as the US Midwest Premium – surged to $850/mt, as buyers rushed to secure physical material before the higher costs took effect. Despite this spike in premiums, LME aluminium prices began to decline, and by April 2nd, when reciprocal tariffs were announced, prices had already fallen to January lows around $2,300/t, suggesting that markets had already priced in the tariff impact. The absence of a post-tariff rally highlights how speculative and pre-emptive buying in February and early March effectively exhausted upward momentum by the time the policy was enacted.
LME Investment Funds Net Total vs 3-month Price
Aluminium prices mirror copper trends, but gains are capped by oversupply in alumina and rising Chinese production.
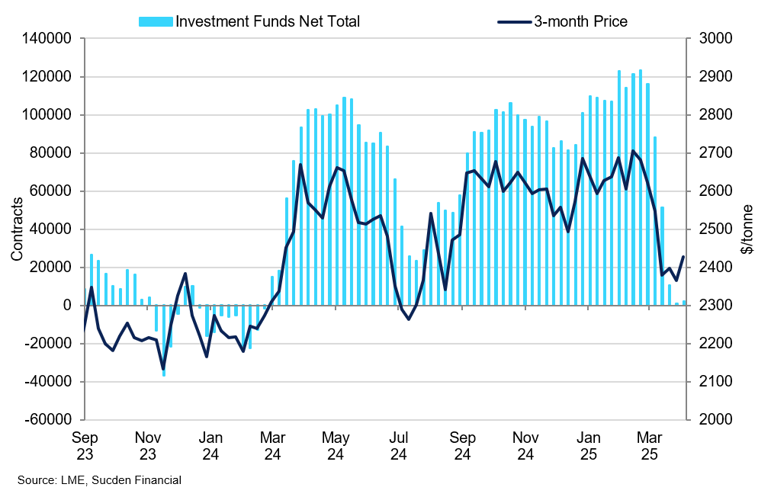
Subsequent exclusion of aluminium from the reciprocal tariff announcements – aside from some downstream products - helped ease lingering concerns about further trade restrictions. This relief supported a moderate rebound to $2,400/t. Aluminium’s price moves have largely tracked those of copper, as tariff-related fears were broadly driven by COMEX/LME arbitrage dynamics affecting the broader complex. However, as copper prices recovered in the remainder of April, aluminium gains lagged.
The reason behind this can be largely attributed to the continued expansion in alumina capacity, weighing on aluminium fundamentals. In March, China’s aluminium production rose by 3.7% YoY, pushing annualised output to 43.8m tonnes – just shy of the national capacity ceiling of 45m tonnes. Moreover, alumina production surged in early 2025, with run rates hitting record highs and output rising 9.0% YTD. This growth is being driven by several factors, including a ramp-up in domestic production and a sharp rebound in bauxite imports from Guinea, which have increased 25% YTD. Looking ahead, this trend is expected to prevail for the remainder of this year, as China is expected to add 7m tonnes of new alumina capacity in 2025. We expect the domestic Chinese market to shift into a surplus in 2025, with additional capacity expansions planned both in China and abroad. Russia emerged as the largest buyer, accounting for 48% of China’s alumina exports last month, effectively helping to redirect surplus supply away from the US market, which has been constrained by tariffs.
A more pressing question is how US smelters will navigate tariffs on Canadian aluminium. Canada is by far the largest supplier of aluminium to the US, accounting for 54% of total aluminium imports in 2024—far outpacing the second-largest source, the UAE, which supplies just 6%. While vehicles and auto parts that meet the USMCA’s regional value content requirements can avoid the 25% tariff, the broader aluminium trade remains heavily dependent on Canadian supply. In fact, Canadian aluminium exports fulfil around half of the country’s imported aluminium demand. Although these measures aim to support domestic aluminium production, many US producers have cautioned that tariffs alone are unlikely to trigger a restart of idled smelters, given high electricity costs and ongoing uncertainty around tariff duration. The exemption of Canadian aluminium is therefore critical to meeting US demand and maintaining supply chain stability.
Q2 Outlook:
We expect LME aluminium to continue tracking copper price moves, with a modest upside bias from April levels. However, any gains are likely to be capped due to persistent fundamental headwinds, including the continued oversupply of alumina, which is then fuelling further growth of Chinese aluminium production. Moreover, with Chinese increasingly rerouting away from the US, the outlook of US aluminium prices will hinge more on the evolving trade relationship with Canada.
Copper
Key points
- Copper remains driven by COMEX dynamics and tariff speculation, which continue to shape market sentiment.
- We do not expect that copper imports into the US will be impacted by tariffs, minimising disruption risks.
- We expect copper to stay within the $9,200–9,500/t range, with upside capped by muted demand and lack of bullish catalysts.
Copper has been pivotal in shaping the base metals complex, with COMEX/LME arb playing a crucial role in influencing the LME market throughout Q1 2025 and April. Prior to the tariff announcements, expectations of heavy copper tariffs led the market to front-load the material, ensuring sufficient US inventories ahead of rising import costs. Unlike the LME, which is smoothed over by embedded costs such as storage, financing, insurance, and VAT, COMEX operates without these factors, leading to more pronounced price fluctuations. Sudden inflows of copper resulted in exaggerated price movements, at a 17% premium over the LME, significantly impacting the broader metals markets.
We expect tariffs directly targeting base metals to remain limited, at least until July, when the current 90-day tariff pause ends. However, market sentiment remains vulnerable to headline risk, keeping the overall volatility elevated. Even if copper tariffs materialise, potential exemptions for major exporters such as Chile, Canada, and Mexico would shield around 80-90% of US copper imports, significantly limiting any fundamental impact.
LME and COMEX Investment Side COT Net Positioning
COMEX/LME arb has been crucial in influencing the base metals prospects, reflecting increasing tariff concerns.

As of April 30th, markets shipped a significant amount of copper to the US, with 144,000 tonnes now sitting at the exchange, representing more than 70% of the total LME storage. In April, the arbitrage opportunity widened again, likely due to the delivery of the material scheduled to arrive ahead of the reciprocal tariffs on April 2nd, considering that shipping typically takes 2-3 weeks on average. Due to the current trade volatility, storing copper in the US might be a hedge against tariff uncertainty, but it could become more appealing to withdraw copper from COMEX and sell it elsewhere in the longer term. This is particularly true if the futures curve shifts into backwardation or if premiums in China or other Asian markets increase.
Despite tariffs on Chinese goods reaching 145%, the impact on Chinese copper is likely to be minimal as the US accounts for only 4.3% of its copper exports in 2024. In fact, despite a significant drop in copper exports to the US, overall copper exports surged by 35% in 2024, reaching 1.3m tonnes, with Taiwan, South Korea, and Thailand purchasing 44.5% of that amount. This is largely due to China's successful diversification away from the US market to other Asian countries. In the meantime, domestic copper production only continues to expand, hitting 1.25m tonnes in March, an 8% YoY increase. This growth is supported by the Chinese government, which is encouraging smelters to opt for long-term contracts instead of more favourable ones and has ignored calls for production cuts. As a result, copper production is expected to remain robust.
Consequently, copper has a stronger fundamental cushion, helping to keep the $8,700/t support intact in the longer-term – a global cost of production. However, a fundamental resistance is now at $10,120/t, and markets would need a fundamental push coming from improving demand conditions in China rather than supply to sustainably breach this level – something we do not expect to happen in the near term.
Q2 Outlook:
Overall, copper will continue to be influenced by COMEX, which is heavily subject to tariff news and announcements. While we believe that the copper tariffs might not be implemented or at least on the scale that would be disruptive for the US, the lingering fears that it might happen should continue to support the flow of copper to the US, which in turn would help support the LME price through the COMEX structure. We do not anticipate significant price gains in the near term, with copper expected to oscillate near its trend average given a lack of a strong fundamental catalyst. Prices are likely to remain within a fair value range of $9,200–9,500/t, supported by dollar weakness. However, any upside is expected to be limited given the currently weak bullish narrative for base metals overall.
Lead
Key points
- US tariffs on imports have negatively impacted battery imports, weighing on longer-term demand prospects for lead-acid batteries.
- Long-term outlook indicates a growing surplus, driven by declining lead-acid battery use as EVs gain traction.
- With the seasonal lull ending, lead prices may recover above $2,000/t, supported by renewed demand from the lead-acid battery sector.
Lead prices tracked broader base metal trends amid heightened trade volatility in recent months, declining sharply below the $2,000/t mark during the significant risk-off event following the reciprocal tariff announcement on April 2nd. However, due to its more cyclical nature related to battery production in China, lead is likely to diverge slightly from the overall complex trend. Lead typically follows a cyclical, oscillating pattern aligned with the lead-acid battery production cycle. The price decline below $2,000/t in early April coincided with the industry’s seasonal slowdown. With the off-season now coming to an end, prices are expected to regain momentum, potentially rising toward $2,100/t.
Lead investment funds net total vs lme 3-month price
Investment funds remain near record short of lead, indicating a more constructive near-term upside potential.
While lead has not been directly affected by tariffs, concerns remain about indirect impacts from auto tariffs, where lead-acid batteries are a key automotive component. Since the beginning of this year, the US has intensified tariff hikes on Chinese goods, with the escalating trade war impacting the automotive sector disproportionately. On April 2nd, 2025, President Trump announced a 25% tariff on imported vehicles, with plans to gradually raise tariffs across all goods to rates as high as 245%. As a result, imports of starter lead-acid batteries into the US fell by 36% MoM in March, with the share of China’s battery exports to the US dropping sharply to just 0.21%, according to SMM. In response to these heightened trade barriers, major U.S. automakers, including Ford and General Motors, suspended exports of certain models to China, moves expected to further depress cross-border trade in lead-acid batteries in 2025. This could further weigh on lead’s longer-term demand prospects, capping a significant price upside in 2025.
From the supply perspective, output of crude and refined lead production in China continued to improve MoM, growing both by more than 90% in March, brought on by output increases across smelters. More capacities continue to come online, and with the off-season for downstream consumption ending, the production is likely to remain stable in the coming months. This should provide a balanced outlook for the lead’s fundamentals in the near term.
The longer-term outlook for lead is less constructive. Similar to zinc, expectations of a growing surplus are becoming more pronounced, weighing on lead’s longer-term prospects. A key factor behind this shift is the gradual decline in lead-acid battery use, as the transition to electric vehicles accelerates the adoption of alternative battery technologies. According to the International Lead and Zinc Study Group, the global lead market is projected to record a surplus of 63,000 tons in 2024, widening to 121,000 tons in 2025. This means that any significant upside in the broader complex will be capped for lead, likely around the $2,100/t resistance level.
Q2 Outlook:
While lead continues to shadow copper and broader base metal trends, we see greater upside potential in the near term. With the off-season for lead-acid battery production approaching the end, both demand and smelter output should recover, which would help solidify support at the $1,900/t level in the coming months. Supported by both a lag in lead’s recent price performance and the onset of the seasonal demand surge for lead-acid batteries in China, we expect marginal strength in the near term. However, we are mindful that growing surplus prospects are likely to cap any robust upside potential, with the resistance at $2,100/t likely to remain intact for the remainder of 2025.
Nickel
Key Points
- Nickel prices remain capped in the $15,000–$16,000/t range, with persistent oversupply and soft Chinese consumption outlook limiting upside.
- Indonesian production is set to remain high, with 2025 mining quotas elevated and no confirmed output cuts, reinforcing global surplus and pressuring prices.
- LME inventories are elevated, and spreads remain wide, indicating speculative positioning rather than physical tightness, while any short-term rallies are likely to be brief and sentiment-driven.
Nickel prices remain under pressure heading into Q2 2025, with the metal trading in a depressed range of $15,000–$16,000/t. Despite headlines around possible supply risks from Indonesia and signs of downstream improvement, structural oversupply and weak demand remain the dominant market themes. With lacklustre support from the stainless steel and battery sectors, and no signs of tightness in LME inventories, nickel is unlikely to find sustained upward momentum through May and June. Any price rallies are expected to be brief and speculative, driven more by positioning and sentiment than by fundamental change.
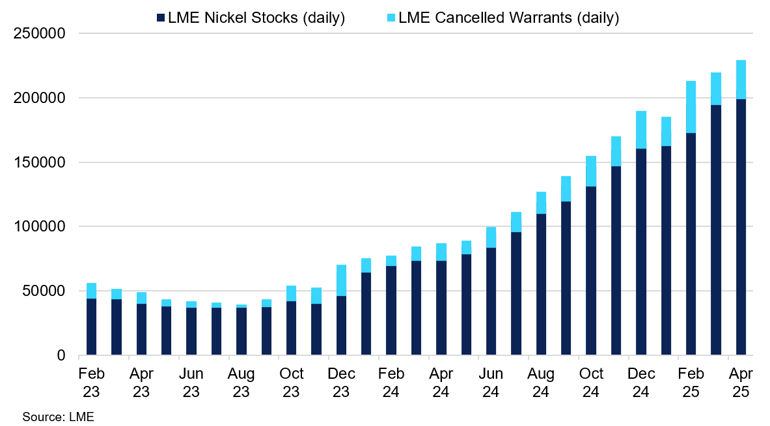
LME Ni Stocks vs Cancelled Warrants
Cancelled warrants have risen, but without corresponding drawdowns, suggesting speculative interest rather than genuine consumption.
Indonesia continues to shape the global supply outlook. In February, the government approved a 2025 nickel ore mining quota of 298.5 million wmt, up from 272 million wmt in 2024. Although the Energy Minister projected actual production closer to 220 million tons, this remains consistent with 2024 output and offers limited price support. Year-to-date approvals suggest producers are on track to maintain volumes, particularly in low-cost NPI and MHP segments. With no confirmed production cuts or delays in key projects, Indonesian output is expected to stay high, reinforcing market oversupply and keeping prices under pressure in the near term.
On the demand side, China’s outlook has softened further. NPI production remained broadly flat in Q1, reflecting subdued stainless steel output and poor downstream margins. The 200-series stainless segment, a key consumer of NPI, remains under price pressure, limiting demand for new nickel units. In early April, the US introduced new reciprocal tariffs on Chinese exports, triggering a broad-based metals sell-off. On 7 April, the SHFE nickel May 2025 contract hit its daily limit-down, closing over 7.5% lower. The SHFE-LME arbitrage window briefly widened on yuan weakness but has since narrowed, reflecting weak interest in nickel imports. Macroeconomic uncertainty is expected to weigh further on Chinese nickel demand in the coming months, particularly as weak margins and cautious sentiment continue to dominate across key end-use sectors.
LME market dynamics also point to ongoing weakness. As of April, warehouse stocks remain elevated at over 201,000 tonnes. Cancelled warrants have risen, but without corresponding drawdowns, suggesting speculative interest rather than genuine consumption. The Cash–3M spread remains wide at around minus $200/t, reinforcing the perception of a well-supplied market. The lack of physical offtake highlights the fragility of near-term demand and further limits upside potential, particularly in the absence of meaningful shifts in end-use sectors.
Q2 Outlook:
The outlook for nickel remains cautious through May and June 2025. Without a material shift in supply or a genuine improvement in Chinese demand, prices are likely to remain capped in the $15,000–$16,000/t range. The $18,000 threshold is expected to remain out of reach under current conditions. Short-term volatility may occur on speculative flows or policy headlines, but sustained gains appear unlikely without broader market rebalancing or a disruptive supply-side shock.
Tin
Key Points
- Tin prices remain volatile in the $30,000–$34,000/t range, supported by strong semiconductor-driven demand, strategic use in AI and electronics, and a thinly liquid market prone to sharp reactions.
- Supply conditions remain fragile, with Myanmar’s key mine still offline, regulatory uncertainty in Indonesia, and ongoing risks to exports from Central Africa, while exchange inventories continue to decline.
- Volatility is expected to persist through May and June, with speculative positioning elevated and tariff-related trade uncertainty amplifying market sensitivity to even minor disruptions.
As we move into the heart of Q2, tin prices remain firmly within a volatile range between $30,000-$34,000/t— but the forces shaping this market are far from neutral. Strengthening semiconductor demand, a fragile and concentrated supply base, and ongoing tariff-related uncertainty in a thinly liquid market are fuelling heightened volatility, with upside risks dominating. Strategic demand tied to AI infrastructure and critical electronics production continues to support prices, while fragile supply dynamics leave the market exposed to sharp reactions from even minor disruptions.
The key demand story for tin in early 2025 has been the strong acceleration in global semiconductor activity. According to WSTS estimates, global semiconductor sales jumped 18%YoY in Q1, driven by booming demand for AI chips and data centre expansion. As the primary soldering material in integrated circuits and printed circuit boards, tin is closely tied to electronics manufacturing, and this growth has translated directly into stronger consumption.
Electronics PMI data further supports the trend, with global readings climbing above 52 in March — marking a return to expansion after months of contraction. This signals a healthier production pipeline through Q2. Despite broader macroeconomic concerns, tin remains relatively insulated due to its importance in strategic sectors like AI, cloud infrastructure, and defence. Among industrial metals, tin stands out with clear near-term demand tailwinds, underpinning continued price resilience into May and June.
On the supply side, the market remains structurally tight. Although Myanmar’s government has signalled intentions to restart operations at the Man Maw mine, the site remains offline as of late April. Early steps towards reopening have been slowed by logistical, regulatory, and financial challenges, and meaningful output is unlikely before late 2025 — delaying the only near-term prospect for a material supply boost.
Indonesia’s refined tin exports rose nearly 50%YoY in March, providing some relief. However, regulatory risks surrounding export policies remain high, with any disruption likely to provoke a swift market response. Meanwhile, geopolitical instability in Central Africa clouds supply forecasts. Peace talks between the DRC and Rwanda-backed M23 rebels have made limited progress, and risks to tin exports from the region — a key global supply source — persist. LME and SHFE inventories, meanwhile, declined in late April, leaving the market increasingly exposed to supply shocks.
Even with firm supply-demand fundamentals, tin price volatility is unlikely to ease. Renewed Trump-era tariff rhetoric has created turbulence across metals markets, and tin is no exception. Though not directly targeted, broader trade uncertainty is spurring erratic responses and heightened speculative positioning. With liquidity thin and few willing sellers, even moderate headlines — from delayed mine reopenings to shifts in Indonesia’s policy stance — could trigger sharp price swings in either direction.
Q2 Outlook:
Tin enters May and June with solid demand drivers, limited supply relief, and a market prone to instability. Robust semiconductor growth and resilient strategic demand offer support, while policy risks and tight inventories add fuel to potential price surges. Under these conditions, tin is likely to remain well-supported — with further spikes possible should fresh disruptions emerge.
Zinc
Key Points
- Zinc continues to underperform other base metals, weighed down by rising supply, soft demand from construction, and limited speculative interest.
- Spot TCs are recovering, suggesting improved concentrate availability and reinforcing expectations of a growing surplus.
- While zinc may track copper movements, we believe that a sustained upside is unlikely without a break above $2,700/t.
Despite zinc traditionally mirroring copper price moves due to being a by-product of the same ore, it has been a consistent underperformer within the LME base metals complex since the beginning of the year, declining by more than 14% since January. Even following the broad sell-off across the base metals complex at the start of April, zinc failed to recover in step with copper, remaining stuck below the $2,700/t resistance level.
China's zinc ore imports vs imported zinc TCs
Recent recovery in spot TCs indicates that market players expect an increase in supply entering the market.
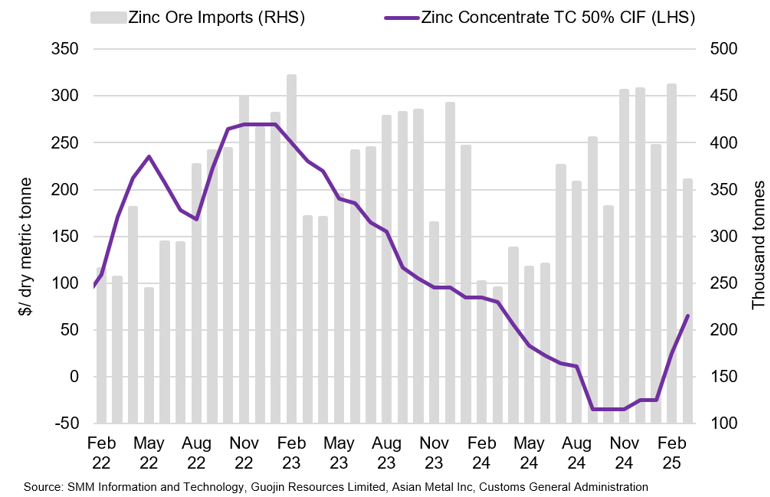
There are several reasons for this divergence. Firstly, zinc attracts fewer speculative players, meaning that copper's speculative-driven volatility does not fully spill over into zinc pricing. Secondly, zinc's market fundamentals suggest that it is entering a longer-term oversupply cycle—an outlook not currently mirrored in the copper market. Adding to this bearish sentiment, treatment charges (TCs) have begun to recover from the lows seen in December. While companies have set 2025 TCs at $80/mt—still well below last year's benchmark of $160/mt—the recent rebound indicates a shift in sentiment. It suggests that smelters and miners anticipate expanding zinc supply, which is weighing on prices from a fundamental standpoint.
Indeed, Chinese production is improving, with imports of zinc concentrate rebounding after a 13% decline in 2024. Inbound shipments rose sharply by 33% YoY over January and February. Notably, China resumed imports from the DRC for the first time in years following the restart of the Kipushi mine, while imports from Russia more than doubled, reflecting the ramp-up of the previously delayed Ozernoye project. The increased availability of concentrates and improved spot TCs are encouraging Chinese zinc smelters to raise operating rates. Although overall output was still down 3.0% in Q1 2025, March production rose 4.0% year-on-year, with expectations for even faster growth in April.
From the demand side, zinc's outlook remains weak, largely due to sluggish performance in China's construction sector, which is traditionally a key driver of zinc consumption. Unlike copper, which is used across a wide range of manufacturing applications, zinc's primary use is in galvanising, which is heavily tied to construction. With galvanising activity not picking up meaningfully, zinc remains vulnerable to the global construction downturn. Broader manufacturing demand is also clouded by uncertainty from US President Donald Trump's tariff strategy. While zinc may at times mirror copper due to trade and supply disruptions, it lacks copper's diversified demand base and speculative appeal. Furthermore, during Trump's previous term, zinc avoided direct tariffs, with measures instead targeting zinc-containing products, limiting the potential for upside driven by tariff-related sentiment that is more present in copper.
As a result, refined zinc is projected to record a surplus of 97,000 tonnes in 2025, marking the beginning of a sustained surplus cycle expected to continue through the end of the decade. While demand is anticipated to remain relatively stable, the surplus will be driven primarily by continued supply growth, particularly from Latin America, with Mexico emerging as the key contributor to this growth.
Q2 Outlook:
While we expect zinc to mirror copper prices to some extent, upside potential is likely to be limited by an increasingly bearish narrative in the physical market. Rising production in China, coupled with subdued domestic and export demand—particularly in die-casting and construction, continue to weigh on long-term price prospects. Although downside risks appear contained for now, a sustained break above $2,700/t would be a key signal for a broader recovery in zinc through the remainder of the quarter.
Iron Ore & Steel
Key Points
- Iron ore prices continued to decline, as rising supply and weakening demand weighed on the metal’s fundamentals.
- Trade tensions and high Chinese steel output have added to surplus concerns, despite short-term export resilience.
- Price are expected to hold above $90/mt, supported by global production cost floors.
On March 12, the Trump administration reinstated a 25% tariff on all steel imports under Section 232, removing previous exemptions for key allies such as Canada, Mexico, and the EU. This move led to a sharp increase in domestic steel prices, with rebar soaring by more than 26% in the construction sector. However, iron ore prices continued to trend lower through Q1 2025, falling from $105/mt to $100/mt. The decline deepened following the Trump administration’s “Liberation Day” reciprocal tariff announcement, pushing prices below the critical $100/t support level. While base metals have since rebounded, iron ore has struggled to recover, weighed down by persistent fundamental headwinds.
China’s GDP YoY vs Net Exports as Share of GDP Growth
Net exports’ growing contribution to GDP growth is raising concerns about China’s exposure to the US through trade flows.
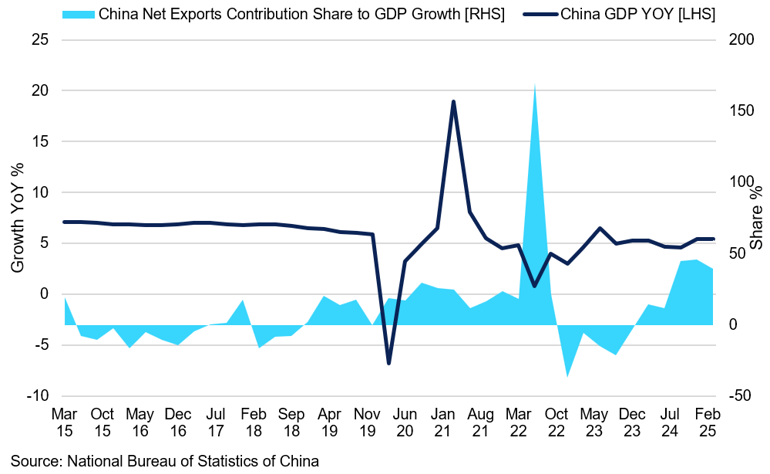
Indeed, in Q1 2025, China’s Q1 2025 GDP growth of 5.4%, while encouraging, revealed a worrying trend: nearly 40% of that expansion came from net exports, as the nation front-loaded on its exports to the US ahead of the tariffs. This reliance on foreign demand exposes the economy to sharper risks as US-China trade tensions escalate. Meanwhile, domestic indicators remain weak. Land sales fell another 16% in Q1, extending the three-year decline. Despite promises to boost domestic demand and shield the economy from external shocks, infrastructure spending under the general public budget dropped by 4.2% YoY, marking the first decline in two years. Investment in key sectors like urban development, water conservation, and transportation remains sluggish. China is actively cutting exports to the US, even at the cost of its own targets. With domestic construction activity still fragile and sentiment subdued, a sustained recovery in steel—and by extension, iron ore—demand appears unlikely in the near term, even if a trade deal is reached.
Q2 Outlook:
How far can iron ore fall? While its decline has been in place since mid-2024 – driven by weakening demand and expanding supply that has heightened surplus concerns – the downtrend has been gradual, indicating that fundamental forces are playing a more dominant role than tariff-related headlines, unlike in the base metals complex. Given this fundamentally anchored weakness, the $90/mt level—widely seen as the global cost floor for production—is expected to act as a strong support, with prices likely to hold above this threshold in the near term.
Gold
Key Points
- Gold hit record highs in April as tariff fears, inflation concerns, and dollar weakness drove safe-haven demand.
- Investor positioning remains strong, with elevated longs and consistent ETF inflows supporting the rally.
- Gold is likely to stay well-supported in Q2 amid policy uncertainty and resilient institutional demand.
As President Trump completed his first 100 days back in office, gold has emerged as one of the year’s most resilient assets. In April alone, prices surged from around $3,000 to briefly touch $3,500 per ounce, setting fresh record highs. While multiple factors have contributed to the rally, it is Trump’s erratic and unpredictable trade policy that has been a key driver. Although tariff threats have been temporarily softened — with a 90-day delay on reciprocal duties and selective exemptions — the underlying policy volatility remains. With markets struggling to price political risk, gold’s appeal as a safe haven is likely to stay elevated in the months ahead.
Gold’s sharp rally was ignited by escalating trade tariff concerns. In the wake of the November 2024 elections, market concerns over potential US import duties escalated quickly, triggering a powerful reaction. Between November and late March, nearly a quarter of global annual gold production was transferred into COMEX vaults — a remarkable shift that highlights the scale of investor anxiety. Yet the story extends beyond physical flows. The broader market responded with a classic risk-off response, with investors seeking refuge in gold as policy uncertainty surged. At the same time, inflation expectations rose markedly. Input costs began climbing sharply, but it was the prospect of widespread consumer price increases — particularly on imports from Asia — that triggered growing concern. The final April reading of the University of Michigan’s consumer sentiment survey showed a significant deterioration in inflation expectations, with the one-year outlook rising to 6.5% — the highest level since 1981, up from 3.3% in January. This sharp shift underscores mounting inflation fears and reinforces gold’s appeal as a hedge.
Markets also began to lose confidence in US financial assets. Treasuries sold off and the dollar declined sharply — with the Dollar Index falling 10% from its mid-January peak, now trading below 99.5, a level not seen since early 2022. This combination of inflation fears, political unpredictability, and dollar weakness created the perfect storm that drove gold’s ascent. These conditions remain relevant going into Q2 and warrant continued attention.
Despite gold’s sharp rally, investor positioning remains constructive. CFTC data shows that long positions remain elevated while short positions have stayed relatively flat since March — suggesting investors are holding onto gains and positioning for further upside. Some degree of profit-taking may occur, but any big pullback is likely to be viewed as a buying opportunity rather than the start of a sustained correction. ETF flows further reinforce this narrative. Since the beginning of the year, gold-backed ETFs have added over 7 moz — growing from 82.85 moz to nearly 90 m. These are not speculative inflows; they reflect broad-based conviction and structural support. ETFs require physical gold to be held in custody, meaning these flows represent real metal demand. This layer of institutional support should provide a buffer against short-term volatility and keep the market well anchored above key technical levels.
Q2 Outlook:
The outlook for gold in Q2 remains firmly bullish. The rally is underpinned not only by safe-haven flows and inflation concerns, but also by strong investor positioning and steady ETF accumulation. While volatility may persist due to policy uncertainty and shifting rate expectations, we expect gold to remain well-supported — with further attempts to retest or even surpass recent record highs. The key drivers to watch over the next two months include Trump’s evolving tariff strategy, inflation data, and movements in the dollar. But with safe-haven demand deeply entrenched, gold continues to look like one of the most resilient assets in today’s uncertain world.
Silver
Key Points
- Gold-to-silver ratio hit 105 in April, reflecting silver’s continued underperformance.
- Industrial demand pressured by slower solar growth, thrifting, and trade uncertainty.
- Ample inventories offset structural deficit, keeping prices capped in the near term.
As we enter the second half of Q2 2025, silver remains detached from gold’s explosive rally. In mid-April, the gold-to-silver ratio surged to a five-year high of 105, far above the long-term average of 70. While this divergence has reignited discussion around silver’s relative value, the metal continues to underperform amid subdued investor interest, fragile industrial demand, and a still-uncertain macro backdrop. Nonetheless, persistent physical tightness and ongoing structural deficits are providing a floor, even as weak ETF flows and limited speculative engagement constrain upside in the near term.
Investor appetite for silver has remained cautious. While April saw modest ETF inflows — with total holdings rising from 1.00boz in March to 1.02boz— these remain well below levels seen during last autumn’s price rally and are still subdued by historical standards. In contrast to gold, where ETF holdings have surged, silver-backed fund flows suggest investors remain unconvinced of a near-term breakout. This divergence underscores silver’s increasingly industrial profile, as safe-haven flows appear largely concentrated in gold.
However, silver’s physical market fundamentals remain relatively resilient. According to The Silver Institute, total silver demand in 2025 is projected to reach 1.2boz, slightly surpassing 2024 levels and marking a fifth consecutive annual market deficit. Yet, despite these structural deficits, inventories remain ample—LBMA holdings stood at 711moz as of end-March, with COMEX warehouse stocks around 501moz in early May. This substantial above-ground supply has tempered perceptions of acute physical tightness, keeping silver prices rangebound and limiting upward momentum compared to gold.
Silver’s industrial story is more complex. Roughly 60% of global silver demand stems from industrial uses — including electronics, automotive, and most notably, solar photovoltaics. While global solar installations continue to grow, the pace is moderating. In 2024, module overcapacity in China and a nearly 25% surge in silver prices prompted manufacturers to cut costs aggressively. As a result, silver loadings per solar cell dropped by around 20%, with further reductions of 10–12% projected for 2025. Unless global installations accelerate sharply, total silver demand from the solar sector may decline year-on-year once again.
Adding to these headwinds is persistent trade uncertainty. The Trump administration’s decision to delay—rather than cancel—reciprocal tariffs on solar panel imports from key Asian exporters, including Vietnam, Malaysia, Thailand, and Cambodia, has prolonged uncertainty in one of the world’s largest solar markets. If implemented, these tariffs could raise input costs and slow installation growth in the US solar sector. Meanwhile, global manufacturing PMIs have softened, and according to the Q1 2025 CNBC CFO Council Survey, 60% of US chief financial officers now expect a recession in the second half of the year—up sharply from just 7% in the previous quarter. These factors continue to weigh on sentiment towards silver’s industrial demand outlook heading into the second half of Q2.
Q2 Outlook:
Silver enters May and June 2025 caught between long-term structural tightness and short-term macro headwinds. While the physical market remains constrained and the global energy transition supports long-term demand, industrial thrifting, tariff risks, and weak investor participation may limit silver’s upside. Unless sentiment shifts decisively or industrial data surprises to the upside, silver is likely to remain tethered to the middle of its current range. As silver continues to behave more like an industrial metal, its trajectory will be shaped less by gold and more by broader economic activity — and in the near term, that keeps its price path modestly supported, but hesitant to rally.
Platinum
Key Points
- Global auto sales recovery (up 6% YoY in Q1) supports platinum’s automotive emissions control demand.
- Production shortfalls in South Africa heighten near-term supply constraints.
- Improving investor positioning and stable ETF flows enhance platinum’s bullish outlook relative to palladium.
As we enter mid-Q2, platinum finds itself on firmer ground, buoyed by resilient auto sector demand, continued supply constraints, and a growing divergence from palladium. With prices consolidating around $970/oz and trading above key moving averages, we believe platinum is well-positioned to outperform in the near term.
Platinum’s industrial demand remains closely tied to its role in automotive emissions control. According to LMC Automotive, global light vehicle sales rose 6% YoY in Q1 2025, with March’s seasonally adjusted annual rate (SAAR) rebounding to 90m units — a marked improvement from late 2024 levels. While EV adoption is advancing (expected to reach 17% of new sales in 2025), the transition remains gradual. Combustion and hybrid vehicles still dominate the fleet mix, sustaining robust demand for platinum in emissions control.
Importantly, platinum continues to benefit from the automotive industry’s shift away from palladium in petrol catalytic converters. With this substitution now largely complete, platinum’s role in emissions control is structurally supported, particularly as internal combustion engines and hybrids still comprise most global vehicle sales despite rising EV adoption.
South African supply concerns remain a critical factor. Anglo American Platinum’s refined platinum production fell sharply by 38% YoY to 170 koz in Q1 2025, driven by flooding at the Tumela mine and scheduled refinery maintenance. While Amplats has maintained its annual production guidance of 1.32–1.50 moz, the significant shortfall in Q1 output raises risks of missing targets at the upper end of this range. If current production levels persist, total South African platinum supply could undershoot expectations by approximately 200 koz, materially tightening an already deficit-driven market. Although above-ground stocks currently exceed 9.5 moz, these inventories continue to diminish due to sustained consumption amid sluggish mine output recovery. With limited prospects for new significant production until late 2025, the near-term market outlook remains supply-constrained.
Investor sentiment towards platinum has stabilised, with ETF holdings levelling off after recent declines, and speculative positioning beginning to shift cautiously positive from previously bearish extremes. In contrast to palladium, where investors maintain pronounced net short positions, platinum appears relatively better positioned. Continued price consolidation above key technical support levels may encourage renewed long positions, especially given the underlying market deficit.
Q2 Outlook:
Entering May and June, platinum’s fundamentals remain robust: steady automotive demand, constrained supply dynamics, and improving investor sentiment collectively underpin a cautiously bullish outlook. While broader macroeconomic volatility may introduce periodic price fluctuations, platinum is fundamentally well-supported and positioned to test higher resistance levels near $1,000–$1,030, with strong technical support identified around $950.
Palladium
Key Points
- Demand pressures persist as palladium loses market share to platinum and BEVs, despite broader auto sales growth.
- Nornickel and South African producers are on track to exceed output targets, deepening surplus risks.
- ETF outflows and renewed net short positioning reflect weak investor confidence and limited speculative interest.
Palladium continues to underperform within the precious metals complex, trading near $945/oz and struggling to sustain momentum despite intermittent speculative rallies. Structural headwinds — including an evolving automotive demand profile, completed substitution by platinum, and persistently cautious investor sentiment — point to a bearish bias in the near term.
Although global vehicle sales rose in Q1 2025 — including a 4.8% YoY increase in the US to 3.91m units — the benefits for palladium remain limited. Battery electric vehicles (BEVs), which do not require palladium-based catalysts, continue to gain market share, while hybrid models are increasingly fitted with platinum-dominant catalyst systems. As a result, palladium’s role within the internal combustion segment is diminishing, with substitution effects now largely embedded across the industry.
In the US, Cox Automotive has revised its full-year forecast for new vehicle sales lower, citing affordability challenges and a projected 200,000-unit increase in used-car transactions. These trends may soften new vehicle demand in the second half of Q2— particularly for segments where palladium remains most heavily utilised.
Palladium supply, unlike platinum, is not tightening. Nornickel, the world’s largest palladium producer, posted a strong Q1 output of 741 koz — putting it on track to exceed its 2025 guidance of 2.76 moz. If this pace is maintained, total annual output could surpass 3 moz. The company has no major maintenance scheduled for the rest of the year and has historically beaten its own production estimates. An overshoot in Nornickel’s output could nearly double the expected market surplus to more than 400 koz. At the same time, the growing share of palladium-rich production from South Africa’s Northern Limb — especially from Mogalakwena mine, where output is forecast to rise 4% YoY — adds to the surplus narrative. With palladium production rising while demand softens, the market risks slipping deeper into oversupply during Q2.
ETF holdings remain under pressure and net speculative positioning has dipped into negative territory again. This reinforces the idea that investors are staying cautious, particularly as the metal continues to underperform platinum and gold. Without a clear catalyst, sentiment is unlikely to shift meaningfully in the short term.
Q2 Outlook:
Palladium’s near-term path remains clouded by structural weakness in demand, persistent production strength, and subdued investor appetite. Unless we see a surprise recovery in auto sales or unexpected supply disruptions, the price is likely to remain capped. We expect palladium to trade within a $910–$970/oz range in May and June, with the risk skewed to the downside. While brief rallies may occur on speculative flows, any strength is likely to be met with selling pressure.

