


Summary
As we move into year-end 2025, the macro narrative remains dominated by geopolitics and the US fiscal and tariff landscape, with the recent government shutdown leaving a significant data gap and complicating the Fed’s policy assessment. This uncertainty has kept volatility elevated across bond and FX markets, even as US, UK and German 10-year yields drift lower. While the US–China truce offers near-term stability, markets remain highly sensitive to shifts in tone, and speculative momentum continues to outweigh fundamentals across key commodities.
In the US, the temporary funding deal provides only brief relief, and despite market conviction for a December cut, we see the risk of a hawkish surprise as underpriced and any pushback from the Fed could trigger a sharp Treasury and dollar repricing. Europe’s outlook remains subdued, with muted growth and cautious ECB communication, though narrowing yield differentials have recently lent the euro some support. China’s resilience to external shocks contrasts with growing domestic strains, including soft retail demand, a protracted housing slowdown and rising deflationary pressures, even as Beijing deepens its strategic grip over critical materials.
Commodities remain driven largely by sentiment. Base metals exhibit selective resilience: aluminium is supported by US import demand and China’s production cap, while copper is buoyed by a tight refined balance. In contrast, zinc, lead, nickel, and iron ore face more fragile fundamentals. Tin remains rangebound on tight supply, while precious metals hold firm: gold consolidates near record highs and silver stays elevated on structural deficits and strong investment flow.
Watch our Q4 2025 Metals Market Webinar
Aluminium
Aluminium is set to remain resilient into year-end, supported by strong US import demand and China’s 45-million-tonne production cap tightening the Q4 balance. Its correlation with copper adds further strength, but a sustained break above $3,000/t looks unlikely without a meaningful demand boost. We expect prices to test this resistance before easing back toward $2,800–2,850/t as fundamentals reassert themselves.
Copper
Copper remains underpinned by a fragile refined balance and steady 2.7% demand growth, leaving the market highly sensitive to any supply headlines. Short-term rallies driven by spread tightness or COMEX-led speculative spikes are likely, although these tend to fade as profit-taking flattens the curve. Prices should stay elevated through year-end, before the broader bullish trend reasserts over the next 6–12 months as supply risks persist.
Lead
Lead’s recent boost from its inclusion on the US Critical Minerals List has lifted sentiment, but the practical impact on supply chains is likely to remain limited. Chinese summer consumption underperformed, and with Q4 typically a softer period for battery demand, fundamental headwinds dominate. Once the policy noise fades, we expect lead to drift back toward its $1,980–2,040/t range into year-end.
Nickel
Nickel remains under pressure in Q4 2025, trading around $15,000–$15,500/t as persistent oversupply continues to outweigh demand. Indonesia’s high output of NPI and MHP keeps the market in surplus. LME inventories have climbed to multi-year highs, while weak stainless steel and battery-sector demand offer little relief.
Tin
Tin trades near $36,000/t in mid-November, supported by tight supply but capped by uneven demand. Indonesia’s export controls and Myanmar’s irregular ore flows keep feed constrained, while only modest semiconductor recovery aids demand. With liquidity thin, prices are likely to stay volatile but contained between $35,000–$37,500/t through Q4.
Zinc
Zinc prices remain supported by prevailing spread tightness and correlation with copper, keeping the market elevated into year-end. However, sustained upside appears limited without a clear rebound in demand. We expect zinc to trade within a $2,900–$3,200/t range through year-end, with risks skewed to the downside as fundamentals regain prominence in early 2026.
Iron Ore
Iron ore continues to soften after shipment risks were repriced lower, while overcapacity concerns and muted construction activity weigh on sentiment. With Q4 historically a slow season for steel demand and no clear signs of a property-sector rebound, the $100/mt support level looks increasingly fragile. Looking beyond year-end, weakening fundamentals and new supply suggest a gradual drift toward $90/mt.
Gold
Gold is consolidating near record highs around $4,100–$4,350/oz, supported by firm ETF inflows and steady central-bank buying. Easing US fiscal tensions and Fed leadership uncertainty are keeping volatility contained, while resilient Chinese demand underpins the floor.
Silver
Silver holds near $50/oz as structural tightness and strong ETF inflows offset softer industrial momentum. With a fifth consecutive annual deficit expected, prices are likely to stay within the $48–$53/oz range through year-end.
Platinum
Platinum is consolidating near $1,550/oz after a strong rally earlier in the year. The market faces its third consecutive deficit, but auto-sector weakness and softer ETF flows are limiting upside. Prices are expected to remain broadly range-bound between $1,450–$1,650/oz into year-end.
Palladium
Palladium trades around $1,400/oz after peaking in October, with sentiment stabilising as ETF inflows offset subdued industrial demand. With the market projected to move into surplus in 2026, prices are likely to hold within a $1,300–$1,550/oz range.
Macroeconomic Outlook
Global Economy
The macro narrative has been completely overshadowed by geopolitics and the US political and tariff landscape in recent months. This was especially evident in the absence of macroeconomic data due to the US government shutdown, which ended on 13 November. Even with a swift reopening, labour data is likely to be released with delays, and some figures may be subject to subsequent adjustments. This patchy data environment provides little economic clarity for Fed officials, heightening the conflict between market pressure to cut rates and economic reasoning, and is likely to fuel elevated volatility in bond and FX markets.
Easing tensions between the US and China, with an extended truce for another year, provide longer-term relief to inventory accumulation. However, markets are likely to remain sensitive to any potential tit-for-tat responses from both sides.
Speculative momentum has been the key driver of commodity price action in recent months, as evidenced in COMEX copper, gold, and silver. We expect that market sentiment will continue to outweigh fundamentals, keeping volatility elevated across the complex.
Oil
Crude oil is set to trade in a broadly range-bound fashion through the final quarter of 2025. Both Brent and WTI rallied in mid-October following new US sanctions on Russian exports, but comfortable supply conditions and subdued demand momentum are limiting further upside. Brent has since steadied in the mid-$60s per barrel, with the market showing little reaction to OPEC+ communications in the absence of additional production cuts. Meanwhile, near-record US output and a gradual build-up in commercial inventories continue to cap prices, suggesting that any renewed strength is likely to encounter selling pressure from producers and traders alike.
On the supply side, OPEC+ surprised the market by pausing its planned production increase for Q1 2026, opting instead for a modest rise of around 137k bbl/day in December. However, the lack of deeper cuts, coupled with the ongoing expansion of non-OPEC output, particularly from US shale, keeps the risk of oversupply firmly in view. US production remains close to record highs, acting as a natural cap on upward price pressure.
Oil demand continues to face headwinds as economic softness in China and slower growth in Europe weigh on consumption, while the broader energy transition narrative tempers long-term optimism. Although prices briefly spiked in mid-October following the announcement of new sanctions, the move quickly lost momentum as underlying fundamentals failed to justify a sustained rally.
We expect oil prices to remain within their current ranges through year-end, supported by balanced market conditions where resilient supply offsets muted demand growth. With OPEC+ maintaining moderate output discipline and US production staying near record levels, neither a sharp rally nor a steep decline appears likely in the near term.
US
US macroeconomic clarity has been overshadowed by internal political pressures in recent months, most notably the US government shutdown, which has delayed the release of key macroeconomic figures, such as nonfarm payrolls. This has left markets with limited clarity on how to gauge the Federal Reserve's monetary policy path. While the government shutdown officially ended on 13 November, the temporary agreement funds federal operations through January, providing only a temporary reprieve. The positive market reaction is likely to be limited, given that the deal merely delays, rather than resolves, the broader fiscal standoff ahead of year-end.
Despite prevailing market conviction pricing in a December rate cut, we remain unconvinced that the Fed will cut so soon. While the continued absence of reliable government data has injected a fresh wave of speculation into the rate narrative, we believe that this makes the Fed less likely to make a pre-emptive move before early 2026. This stands in contrast to the prevailing market consensus, which has doubled down on a continuous easing cycle following last month's cut, adding to bullish bias in US Treasuries, keeping the dollar pinned near key resistance at 100.50.
University of MiChigan Sentiment & 1yr Inflation Expectations
Sentiment deteriorates as inflation expectations remain elevated.
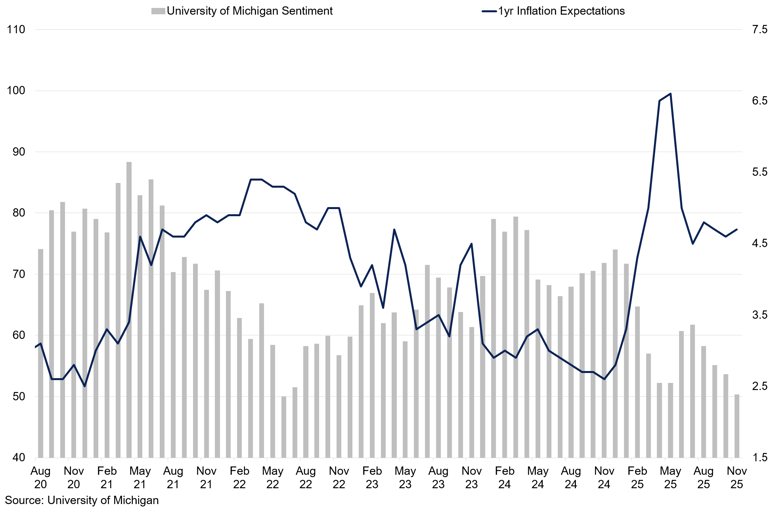
However, we caution that with positioning becoming so one-sided and conviction for cuts reigniting, the risk of a hawkish Fed surprise is underpriced. Should Chair Powell signal that a December cut is off the table, markets could be caught off guard, triggering an abrupt repricing in Treasury yields and a sharp rally in the dollar as volatility returns to the forefront.
Europe
The European Union outlook appears relatively more predictable than the US, with lacklustre growth underlined by persistent stagnation, subdued business confidence, and Germany’s industrial output showing little sign of recovery. GDP weakened slightly to 1.3% YoY in Q3 2025, as inflation inches closer to BOE’s 2.0% target, with pricing pressures growing by 2.1% YoY in October. The ECB maintains a cautious stance, emphasising that rate cuts are premature until underlying inflation cools further.
However, EU assets are increasingly being evaluated based on their relative performance to the US, particularly in light of expectations for Fed monetary easing. Recent US data have shown a continued slowdown of momentum, with weaker ADP employment figures and a slowing services sector fuelling expectations for one or two Fed cuts by early 2026. This growing policy divergence has narrowed the yield gap between Europe and the US, providing some support for the euro, even as the region’s fundamentals remain muted.
We believe that in the coming months, the broader EUR/USD trajectory will depend on how aggressively the Fed moves to ease policy against a backdrop of softening labour growth and prevailing US fiscal concerns. Should the Fed keep rates unchanged in December, as we expect, this could deliver a sharp surprise to markets. With growing vulnerabilities in Europe’s economic performance, this combination could drive euro weakness into the year-end. However, we remain cautious on the downside, as support around the 1.1250 level is likely to hold, while ongoing US fiscal uncertainty and expectations for delayed rate cuts into 2026 should limit further dollar strength.
China
China has demonstrated a remarkable ability to absorb external shocks, from tariffs and trade disputes to export restrictions, and still keep its economic rhythm. When the US imposed new duties on selected Chinese goods earlier this year and threatened broader export bans, Beijing did not respond with panic or retaliation. Instead, it adjusted quietly but decisively, signalling a new phase of economic maturity. The underlying message was clear: China no longer sees itself as a peripheral participant in the global economy, but as a self-sustaining manager of its own interconnected system.
Yet that system is now revealing its strains. Official data show China’s GDP growth slipped to 4.8 % in Q3 2025, its softest pace in a year, weighed by weak retail demand and a beleaguered housing market. The government’s “dual-circulation” strategy, which aims to accelerate domestic consumption while retaining global export links, is being tested by a slump in property investment and overcapacity in industries ranging from EV manufacturing to rail. Housing inventory now sits at multi-year highs, and local government land sale proceeds continue to shrink, putting fiscal pressure on regional authorities.
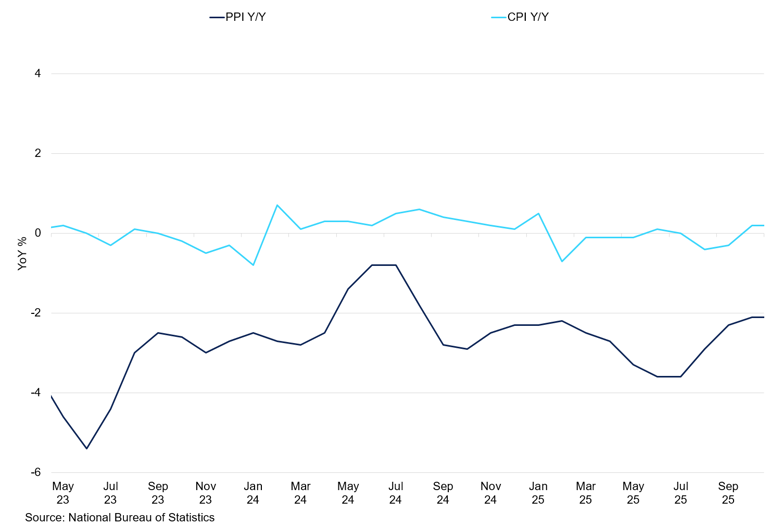
China PPI vs CPI YoY
China still faces deflationary risks.
At the same time, China is betting harder on technology and resources that the world simply cannot ignore. In October, the country expanded its export controls on rare-earth elements from seven to twelve categories, a move widely understood as Beijing flexing leverage over global supply chains. With about 92% of rare-earth refining and 98% of magnet production under its roof, China is tightening its grip on the levers of global industrial access. Such moves serve both as industrial strategy and geopolitical signal, reminding trading partners that China’s dominance in critical materials is as much a tool of diplomacy as it is of economics.
Meanwhile, the housing market, once the engine of China’s growth story, remains trapped in a prolonged slowdown. Developers continue to struggle with heavy debt burdens and large volumes of unsold properties, while policymakers are proceeding cautiously to prevent a wider financial crisis. Estimates suggest that the current inventory of unsold homes could cover between four and six years of typical sales. At the same time, local governments, deprived of revenue from land sales, are tightening budgets and scaling back spending, deepening the gradual drag on consumption and broader economic momentum.
As Beijing approaches the next five-year plan, the narrative is shifting from rapid catch-up growth to one of managed resilience. Investment is likely to focus on critical infrastructure and strategic industries such as AI and quantum computing, yet consumer confidence remains weak and households appear reluctant to spend. The transition from property and infrastructure towards higher-value output will take time, and until domestic demand strengthens, China’s recovery is likely to remain uneven and slower than its policymakers would prefer.
Aluminium
Key Points
- Both speculative and fundamental factors indicate aluminium prices should remain resilient through year-end.
- Ongoing demand for aluminium imports into the US, combined with the upcoming production cap of 45m tonnes in China, is tightening the Q4 2025 market balance.
- However, we remain cautious as $3,000/t appears to be a key resistance, and markets would need a fundamental demand push for prices to breach this level.
Aluminium jumped higher in Q3, surpassing the key $2,800/t level and reaching $2,900/t by the end of October – a May 2022 high. While aluminium initially tracked copper higher, recent weeks have seen speculative positioning highlight a growing divergence in aluminium’s favour.
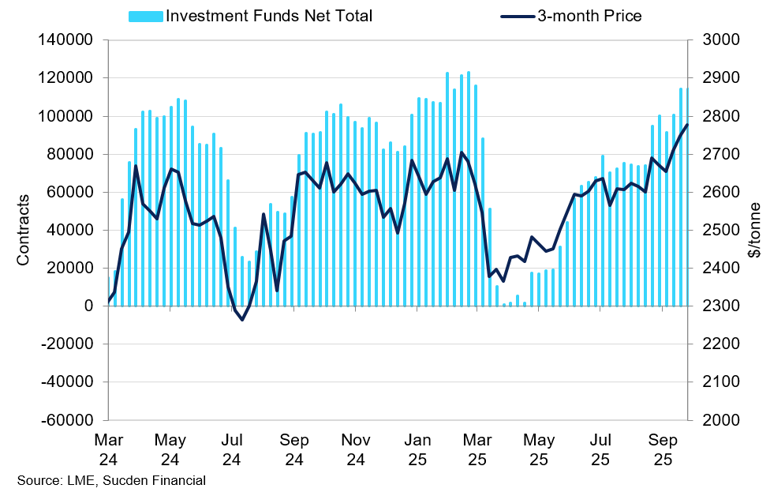
LME Investment Funds Net Total vs 3-month Price
Investment fund net positioning has steadily increased in recent months.
Firstly, resilient US demand for imported aluminium means that pre-tariff front-loaded inventories are starting to dwindle. This is evident in the Midwest Premium, which has strengthened to $1,900/mt. The jump of 134% since June exceeds the 50% tariff implemented by the Trump administration, highlighting persistent import appetite. Estimates place US aluminium inventories at 300,000-400,000 tonnes by the end of Q3 2025, covering approximately a month of primary consumption.
Canada remains the dominant supplier, accounting for 70% of all aluminium imports, though inbound volumes have slipped by more than 20% from January to August. While Canadian producers initially diversified their flows to Europe after tariffs first took effect, exports are starting to return to the US. This suggests that most costs have now been passed to consumers, and flows should start to improve, but at a higher import premium. Moreover, the impending 45m tonnes production cap in China has created a tighter fundamental outlook for aluminium for the remainder of the year. If US tightness exacerbates into the winter or if global stocks begin to flow West, we expect LME prices may start to factor in a tighter 2026 balance.
Secondly, we note that aluminium tends to gain relative interest and price support during copper’s low-volatility phases, reflecting a rotation of discretionary flows within the base metals complex. However, when copper volatility spikes, often on macro or supply shocks, aluminium quickly re-correlates. Combined with the extension of the tariff truce between China and the US for another year, this has created a strong speculative cushion for aluminium, with support at $2,800/t now clearly established.
Looking ahead into 2026, supply risk from Guinea, a key bauxite exporter, is now diminishing. Bauxite export growth picked up by 23% YoY to around 40m tonnes in Q3 2025, with expectations of further growth in Q4. Globally, we expect 2025 bauxite production at 390m tonnes, down from 395m tonnes in 2024. Still, from the refined balance perspective, we see an aluminium surplus at 300,000 tonnes this year, expanding to 480,000 tonnes in 2026. This suggests that any upside is likely to be driven by speculative flows rather than fundamentals. Still, we believe that a breach of $3,000/t would require a fundamental shift in demand, which we do not expect to take place in the near term.
Q4 Outlook:
Aluminium’s close link to copper, combined with continued demand in the US, creates a strong foundation for prices. However, we remain cautious as $3,000/t appears to be a key resistance and markets would need a fundamental demand push for prices to breach this level, something we do not expect for the remainder of the year. Hence, the most likely outcome is a potential move up to this threshold before dipping back to $2,800–2,850/t.
Copper
Key points
- With a refined copper deficit projected for this year, the fundamental balance appears fragile to any potential supply announcements.
- While rallies on supply scares can steepen backwardation temporarily, these are likely to fade into profit-taking, flattening the curve again.
- For the remainder of the year, we anticipate prices will stay elevated, driven more by spread tightness or COMEX-driven speculative activity.
The news of supply disruptions prompted copper to break out of constrained ranges, reaching a record high of $11,200/t. The mine shutdown at Grasberg, which declared force majeure in October, has shifted the perception of a fragile market surplus into a deficit. With nearly 3.6% of global production now being taken out from Grasberg, our current projections stand at 200,000 tonnes of deficit this year. While this shortage may be partially offset by an increase in scrap supply, the fragility of this balance suggests that copper is more prone to short-term squeezes, especially on any other announcements of disruptions.
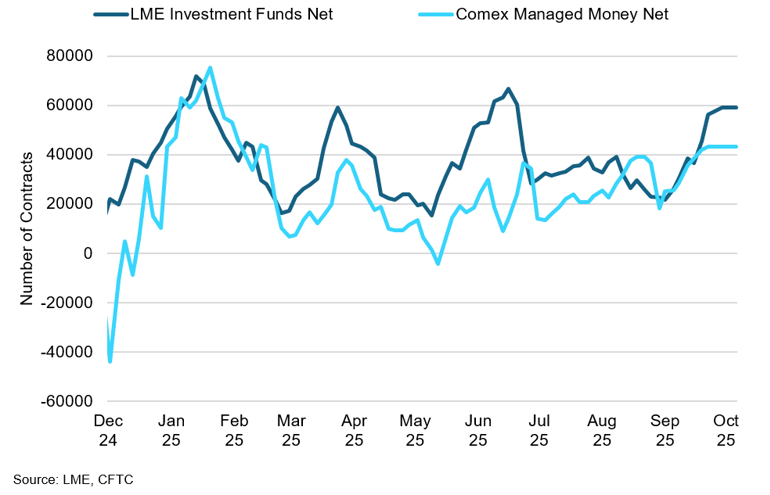
LME and COMEX Investment Side COT Net Positioning
Investment fund net positioning remains elevated at both LME and COMEX.
By declaring force majeure, Grasberg implied that impacts extend beyond a short outage, with the likelihood of extended closure. Moreover, Indonesia’s ban on concentrate exports since the start of this year also complicates logistics, as the policy requires all copper concentrate to be processed domestically, forcing miners to rely on local smelters that are still in their ramp-up phase. Until full domestic refining capacity is operational and stable, the ban effectively reduces flexibility in responding to disruptions, amplifying production risks.
The other two major mines are located in Chile, with Escondida and Collahuasi contributing 5.5% and 2.4% of the global production, respectively. In Escondida, despite degradig ore grades, recent monthly prints have been stable to up despite Chile’s broader struggles. Collahuasi, on the other hand, is more exposed, with double-digit YoY drops in recent months tied to lower grades.
Looking ahead, the refined market balance is expected to return to a modest surplus by 2026, around 100,000 tonnes according to the current consensus. However, this surplus looks fragile, with mine disruptions and modest outperformance in refined output skewing supply risks towards the downside. We expect that markets will remain hypersensitive towards any production headlines, triggering front-end tightening, reflected in sharper cash-to-3M backwardations, even if the broader curve implies adequate supply later.
At the same time, flat demand growth limits how far outright prices can sustainably rally. While rallies on supply scares can steepen backwardation temporarily, these are likely to fade into profit-taking, flattening the curve again. This could indicate a pattern of bouts of tightness followed by normalisation, within a gently bullish underlying structure.
China copper TCs have hit a record low of –$46.50/t, underscoring an exceptionally tight concentrate market. Global mine supply is rising only modestly, while smelting capacity expands faster amid ongoing grade pressures. The 2026 benchmark may fall to zero, prompting miners to pursue floor-and-cap or tolling deals instead of fixed benchmarks. This shift could reduce transparency, heightening volatility as LME reacts more sharply to disruption headlines. Persistently negative TC/RCs risk smelter curtailments, tightening refined supply, and amplifying price sensitivity to any mine or smelter outage. Overall, copper’s refined balance remains fragile and disruption-prone.
Q4 Outlook:
We hold a longer-term bullish view (6–12 months) on copper, as markets remain in a fragile balance, and any new supply disruption announcements are likely to trigger upside price spikes. Demand growth remains steady at around 2.7%, with data centres offsetting weakness in machinery, transportation, and construction. For the remainder of the year, we anticipate prices to stay elevated, with short-term upside spikes likely, driven more by spread tightness or COMEX-driven speculative activity.
Lead
Key points
- While the addition to the Critical Mineral list boosted lead’s appeal, we believe the impact on existing supply chains might not be evident.
- Chinese consumption during peak summer months disappointed, suggesting weaker fundamental demand.
- This, in combination with the traditionally quieter Q4 consumption period, suggests that once the news filters through, lead faces strong price headwinds.
In November, lead prices rallied to March highs of $2,090/t, breaking out of the $1,950-2,050/t range that had kept price action subdued for most of Q3 2025. The jump was driven in large part by the recommendation to add lead to the Critical Materials list. While the listing serves as a signal and policy eligibility tool rather than a binding regulation that automatically mandates a production change, the markets rushed to borrow the metal, especially in near-term contracts.
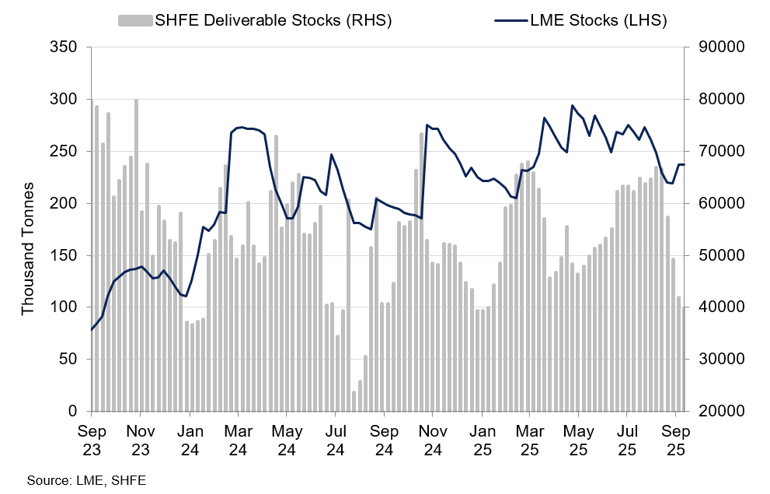
SHFE LEAD deliverable stocks vs lme stocks
While SHFE deliverable stocks dropped, LME stocks remain elevated.
According to USGS estimations, US lead mine production in 2024 was 300,000 tonnes of contained lead, primarily as a byproduct of other mining operations. Refined lead production from secondary sources, yielded 1.0 million tonnes. However, around 34% of the US's apparent consumption is met by imports of refined lead and its products, mostly from Canada, Mexico, and Peru. With no large-scale primary lead smelting in the US, the country also relies heavily on secondary lead from recycled batteries.
If implemented within the list, we expect the tangible impact on lead imports to remain relatively limited, given that the majority of imports are from “friendly trades”. Most likely, the outcome would lead to ensuring funding and policy support to reduce dependence, rather than to implement defensive tools like tariffs. Given lead’s moderate liquidity and traditionally a lower volume traded in comparison to copper, prices above $2,050/t would likely be a speculative overshoot and fade once policy news is absorbed into market fundamentals.
Indeed, from a physical consumption perspective, demand remains soft, with LME stocks now restocking following the peak consumption season. Peak season consumption around the summer months has not materialised, and instead of increased production, Chinese stockpiles have withdrawn, suggesting that consumers were aware that demand growth was slow that even peak production would not require additional supply. Mine production is expected to grow by 2.0% in 2025, reaching 4.60 million tonnes. With Q4 also a traditionally weaker demand season, the fundamental outlook for lead appears weaker.
Q4 Outlook:
While the addition to the Critical Mineral list boosted lead’s appeal, we believe the impact on existing supply chains might not be evident. These lists serve to ensure funding and policy support to reduce dependence rather than to implement defence tools like tariffs. This, in combination with the traditionally quieter Q4 consumption period, suggests that once the news filters through, the metal is likely to return to its $1,980-2,040/t range by the end of the year.
Nickel
Key Points
- Oversupply persists, with a 2025 surplus estimated at around 279 kt.
- Demand stays weak as stainless output softens and battery nickel use declines.
- Speculative flows dominate, keeping prices near $15,000–$15,500/t.
Nickel moves through Q4 2025 still weighed down by persistent oversupply and lacklustre demand. Despite intermittent volatility, the market remains fundamentally imbalanced, with inventories still rising and little evidence of supply restraint. Global nickel balances are expected to stay in surplus through year-end, with MineSpans by McKinsey & Company projecting an oversupply of around 279 kt for 2025. Indonesia continues to dominate the supply landscape, with rising production of nickel pig iron (NPI) and mixed hydroxide precipitate (MHP) offsetting earlier expectations of moderation. Although occasional operational and logistical disruptions have occurred, the supply side remains resilient. LME nickel stocks have climbed above 250 kt, the highest since mid-2021, while cancelled warrants remain minimal, highlighting the absence of physical tightness. The nickel cash-to-three-month spread, trading near –$200/t, confirms abundant availability and weak nearby demand.
Seasonal rainfall in Indonesia could introduce brief supply constraints in late Q4 as the wet season disrupts ore transport and feedstock supply. However, increasingly erratic weather patterns mean both heavy flooding and prolonged dry spells remain possible. On 3 October, the Indonesian government shortened the validity of mining production quotas from three years to one, seeking greater control over output levels. While this policy shift could add speculative support as miners reapply for 2026–2027 quotas, it is unlikely to materially affect near-term production. Without a corresponding reduction in NPI output or a clear improvement in demand, any price rebound is expected to be modest and short-lived.
On the consumption side, stainless steel production, responsible for roughly two-thirds of global nickel use, remains subdued across China and Europe. Producers continue to face margin pressure, with weak construction activity dampening orders and little incentive for restocking given soft end-user demand. The battery sector has shown slight improvement alongside the gradual recovery in EV output, yet gains in efficiency and the growing shift toward lower-nickel chemistries continue to limit the rise in nickel intensity. Precise figures for 2025 remain limited, but available data indicate that nickel use per battery fell by nearly a third over the four years to 2024. Looking ahead, policy headwinds such as the expiry of the US EV tax credit are likely to further curb demand for nickel-intensive cathode chemistries. Overall, the demand backdrop for Q4 appears steady but uninspiring, with little sign of acceleration absent stronger Chinese stimulus or new EV incentives in early 2026.
Investment fund positioning underscores the market’s indecision. Both long and short exposures have increased into October, with gross shorts rising sharply and leaving net positions only marginally positive. This pattern suggests speculative rather than fundamental engagement, reflecting a market dominated by trading flows rather than conviction. Such dynamics reinforce the broader view of nickel being trapped in a structural surplus, with sentiment constrained by persistently high inventories and limited physical tightness.
Q4 Outlook:
We expect nickel prices to remain range-bound through the end of 2025, anchored by oversupply and fragile consumption. Periodic speculative rallies could lift prices toward $15,500/t, particularly if weather disruptions or policy headlines arise, but sustained gains appear unlikely. Without tangible supply restraint or a meaningful recovery in demand from the stainless steel and battery sectors, nickel is likely to consolidate between $15,000–$15,500/t through Q4 before potential reassessment in early 2026.
Tin

Key Points
- Tin’s nearby balance remains tight despite steadier output, with Indonesian enforcement and patchy Myanmar flows sustaining supply risk.
- Supply recovery is uneven, keeping Chinese smelter feed constrained.
- Semiconductor-led demand is improving, but thin liquidity leaves prices volatile within a broadly supported $35,000–$37,500/t range.
Tin moves through Q4 2025 with the balance sheet still tight on the nearby, even as headline output looks steadier. Indonesia’s stepped-up enforcement and export checks have heightened medium-term supply risk, while Myanmar ore flows remain patchy. LME prices are hovering around $36,100/t into mid-November, recovering from the dip earlier in the month but shy of the early-October highs above $37,500/t as the market weighs enforcement headlines against tentative restocking. Visible inventories have rebuilt from the lows but remain lean by history: LME stocks sit near 3 kt, SHFE stocks have fallen below 6 kt, and the nearby curve retains a backwardated profile, signalling tight prompt metal.
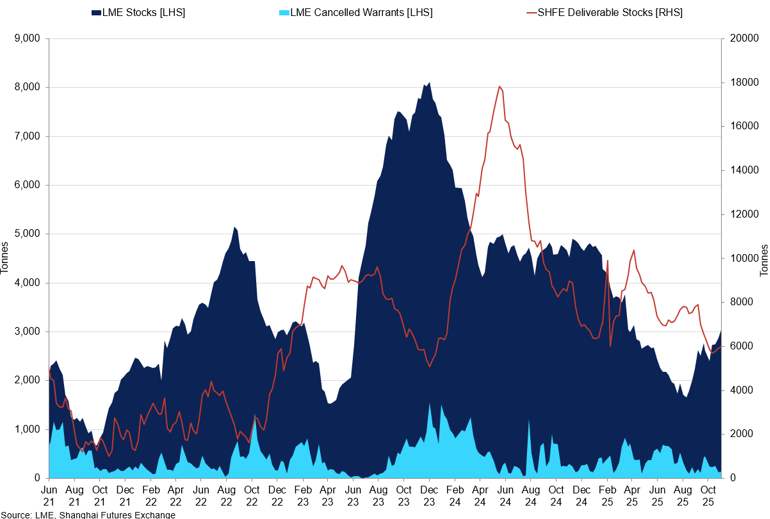
Tin LME Stocks vs Cancelled Warrants vs SHFE Stocks
LME inventories have recovered from earlier lows but remain historically thin.
On supply, the tone is finely balanced. Indonesia’s crackdown on illegal mining and stricter export checks are disrupting unofficial supply channels. These measures could redirect flows toward the formal sector over time, but the transition is uncertain, and near-term feed remains constrained. Myanmar’s return to the market has been halting, with ore shipments from the Wa State’s Man Maw mine still far below pre-suspension levels, according to the International Tin Association. Despite the formal lifting of the mining ban earlier this year, operations remain constrained and concentrate flows into China have been sporadic. In Africa, output recovery has also been uneven following earlier disruptions in the DRC, where Alphamin have faced logistical and security challenges. As a result, Chinese smelters remain highly sensitive to variations in ore quality and delivery timing, keeping effective feed supply tight despite ostensibly stable headline output.
Demand is improving at the margin but remains uneven. Tin’s core in solder keeps it tethered to electronics, where the cyclical upswing is led by AI- and data-centre-related compute, with consumer devices still mixed. According to the Semiconductor Industry Association (SIA), global semiconductor sales rose sharply through 2025, increasing by 21.7% in August. This steady growth has helped stabilise production run-rates among key downstream customers. That said, discretionary electronics and export orders are not firing on all cylinders, tempering the pace of drawdown. Overall, Q4 is shaping up to show firmer, though not strong, demand. This should support nearby spreads, but a significant tightening in the market is unlikely unless new supply disruptions occur.
Positioning and liquidity remain swing factors. Managed money has rebuilt net length to about 4410 contracts as of late-October, with gross longs edging higher but shorts still present, leaving the market vulnerable to two-way squeezes. With LME liquidity thin, shifts in positioning can transmit quickly to the curve; the cash-to-3 premium near $140/t alongside a smaller cash-to-15 move suggests tightness is most acute in the very prompt window, where any delivery hiccup or export delay can trigger outsized price action. Recent Indonesian enforcement headlines helped drive the early-October rally above $37,500/t, highlighting the market’s sensitivity to policy developments.
Q4 Outlook:
We expect tin to trade volatile but broadly supported, consolidating in a $35,000–$37,500/t range, with scope for brief spikes toward $38,500–$39,000/t if prompt tightness reintensifies due to possible weather or export disruptions. Downside risk to ~$33,000/t emerges if semiconductor momentum cools or if Indonesian supply normalises faster than expected. Near-term spreads should stay in backwardation, with cash-to-3 elevated versus cash-to-15, reflecting persistent prompt tightness rather than a fully tight forward balance.
Zinc
Key Points
- Zinc’s prevailing spread tightness and its close link to copper performance is expected to keep prices elevated into the year-end.
- However, and a sustained upside would likely require a meaningful shift in demand, which we view as unlikely.
- Starting in 2026, the outlook shifts as market attention returns to zinc’s fundamentals, which point to a growing global surplus that could weigh on prices.
Zinc prices have continued to climb higher, supported by copper’s rally. The correlation between the two metals, which has traditionally been positive, surged above 80% in recent months, reflecting a growing speculative convergence that fundamentals alone would suggest. The copper supply tightness narrative has fuelled zinc’s breakout above the December 2024 high of $3,000/t. The recent price action has been most pronounced in the spreads, which have surged to $350/t, maintaining a deep backwardation through October.
China’s TCs for Imported and Domestic Zinc
Zinc treatment charges in China have rebounded sharply in 2025.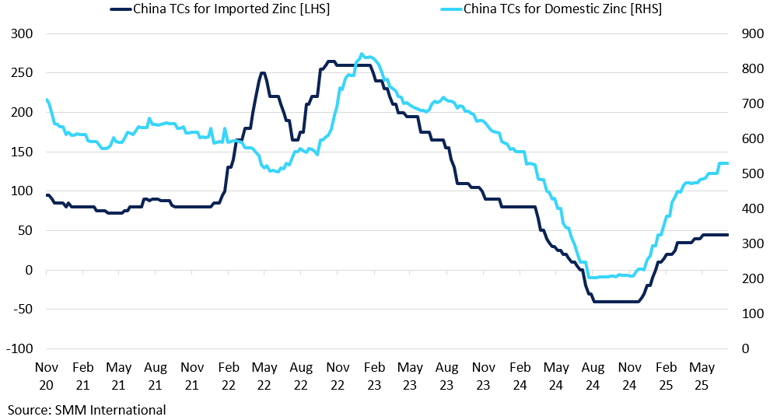
However, in our view, zinc is lacking a compelling fundamental narrative to drive prices meaningfully above current levels. Unlike copper, which benefits from a physical deficit, zinc is not as physically tight a market. While production in Europe remains lacklustre, it is broadly in line with weaker regional demand, suggesting a balanced market. In China, growing smelting capacity is expected to largely outpace demand growth in 2025. We do not foresee demand improving significantly next year, as infrastructure, its main source of demand, continues to stagnate, adding headwinds to any meaningful price growth.
Globally, we forecast a surplus of 200,000 tonnes in 2025, which is expected to widen further into 2026-27. This is the opposite of copper’s tightening path, which sees pronounced deficits from 2027 onward, underscoring our expectation of growing divergence between the two markets. This suggests that speculative flows, rather than fundamentals, are driving the recent moves. While tight nearby spreads may keep zinc prices elevated and volatile for now, we expect that by early 2026, market concerns about supply shortages should ease, with zinc’s underperformance relative to copper becoming more apparent. This shift could prompt investors to unwind zinc spread risk, leading to weaker forward pricing from January.
As we move into year-end, our attention is turning to 2026 treatment charge (TC) negotiations. While the 2025 TC benchmark was set at $80/t, spot TCs have plunged once again in recent weeks, to around $100/t, suggesting unsustainable environment for smelter margins. Should TCs continue to weaken into the year-end, a marginal slowdown in refined zinc output could materialise in late 2025, potentially providing a floor to prices. Nevertheless, without a tangible rebound in end-user demand, zinc’s structural surplus suggests that any rallies are likely to be short-lived and driven by flows, not fundamentals.
Q4 Outlook:
While zinc and copper present divergent fundamentals in the long term, speculative sentiment is likely to drive price action into year-end. Zinc may continue to shadow copper and could experience sharp, short-term spikes, especially if supply disruptions hit the copper market. That said, $3,200/t represents a strong resistance, and a sustained break above would likely require a meaningful shift in demand, which we view as unlikely. With spreads still tight, the $2,900/t level appears well supported. At the start of 2026, we expect speculative sentiment to fade, leading to more prominent softness in zinc market.
Iron Ore & Steel
Key Points
- Iron ore prices weakened after shipment risks, including port fee disputes, were repriced lower.
- Iron ore continues to face overcapacity risks and muted construction demand, both weighing on price prospects.
- With Q4 traditionally a slower construction period, and no clear signs of a property rebound, iron ore’s $100/mt support looks fragile.
Iron ore prices have become increasingly dislocated from the base metals complex, reflecting the deepening weakness in China’s construction sector and a lack of speculative interested that has buoyed other metals. Prices have been largely capped around $108/mt so far this year, with ample seaborne supply and muted steel demand weighing on sentiment. The only recent volatility came from the temporary suspension of dollar-denominated cargo purchases by China’s state-run iron ore buyer, tied to port fee and payment system issues. As a result, prices that had been holding above $105/mt briefly fell to $103.50/mt before stabilising. While the new port fee policy initially raised concerns about higher import costs, Beijing’s clarification that vessels with US ownership or built in China will be exempt eased those fears, implying that supply risk has not been fully eliminated but repriced lower.
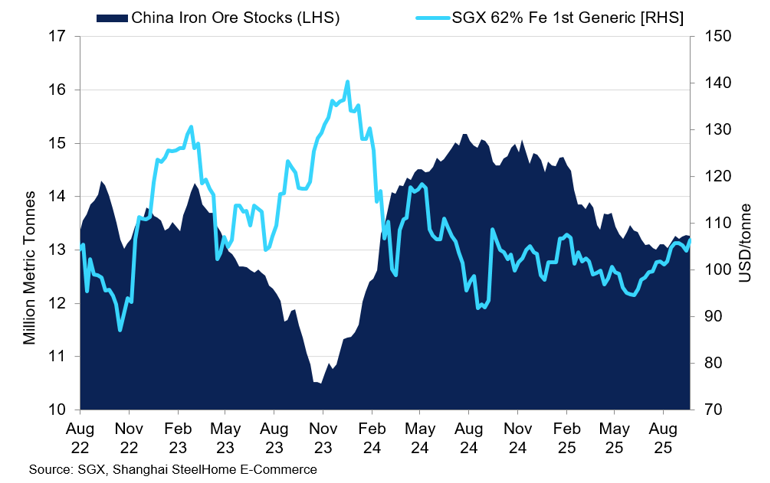
China iron ore stocks vs sgx 62% fe iron ore price
China iron ore stocks have been decreasing steadily since the start of the year.
On the demand side, construction remains muted, with property investment still contracting. China’s infrastructure stimulus has provided only partial offset, preventing a deeper collapse in demand. With Q4 traditionally a slower construction period, and no clear signs of a property rebound, iron ore’s $100/mt support looks fragile, in our view. Structurally, China is set to remain the dominant driver, but persistent weakness in property and construction caps the long-term upside potential. Unless stimulus measures accelerate or non-construction steel demand surprises to the upside, iron ore prices are likely to remain rangebound with a downward bias.
Steel mill profits remain under pressure, with less than 40% profitable, according to Mysteel. Blast furnace utilisation and output both continued to weaken, signalling a production pullback despite recent restocking. China’s iron ore imports hit 111.3Mt in October, staying above 100Mt for the fifth straight month, pushing mill and port inventories higher and adding to the oversupply. The buildup comes just as Guinea’s Simandou project begins to ship its first ore, further weighing on domestic prices. Indeed, there are growing reports that iron ore producers are redirecting shipments away from China towards Southeast Asian nations, as Beijing shifts focus to domestic consumption, with the expansion domestic supply feeding directly into growth.
Q4 Outlook:
For Q4 2025, our focus will be on production and shipment timing, along with Chinese import levels, stock trends, and potential flare-up of logistic risks from major exporters. Beyond year-end, we expect further price moderation toward $90/mt as construction demand weakens further, and new supply gradually enters the market. Given these structural headwinds, including weak construction, overcapacity risk, and new mines coming online, the upside appears capped.
Gold
Key Points
- Gold is consolidating near record highs as investment inflows remain strong despite cooling momentum.
- US fiscal progress and Fed leadership uncertainty continue to shape near-term volatility.
- Structural support from central-bank buying and resilient Chinese demand underpins prices within a $4,050–$4,350/oz range.
Gold moves through Q4 2025 in digestion mode after printing fresh records above $4,350/oz and then retracing as momentum cooled. The pause comes despite persistent macro risk and heavy investment interest. Inflows to gold funds have been exceptional, with Bank of America reporting $8.7 billion in a single week in late October and roughly $50 billion over four months, underscoring that dips continue to attract capital. World Gold Council data indicate global ETF holdings rose again in October, led by North America and Asia. Together, these signals point to firm underlying sponsorship even as prices consolidate near $4,000/oz.
In the US, the government shutdown saga has come to a resolution. A bipartisan agreement was reached on 13 November, easing short-term fiscal anxiety and slightly tempering safe-haven flows into gold. However, the reprieve may prove temporary if deeper political divisions resurface ahead of the 2026 budget cycle. With fiscal tensions easing, investor focus is shifting back to monetary policy and the future of Fed leadership. Chair Powell’s term ends in May 2026, and President Trump has yet to make a formal nomination, though several potential successors have been floated. The prospect of a leadership change, especially under a politically charged selection process, adds an element of uncertainty that could keep gold supported through intermittent bouts of volatility. Meanwhile, ETF inflows remain robust, with October’s surge in holdings signalling that investors continue to view gold as a core portfolio hedge despite short-term swings. Near-term pullbacks are therefore likely to attract renewed buying interest, keeping prices broadly resilient even as the macro backdrop evolves. Central banks remain consistent net buyers, with steady monthly additions from China, India and Turkey reinforcing the market’s long-term floor and signalling ongoing diversification away from the dollar.
While attention in the West remains fixed on US policy and Fed leadership, developments in China are shaping the physical side of the gold market. In November, the Shanghai Gold Exchange reduced transaction costs by waiving a range of fees on key contracts, including physical gold benchmarks and silver, with some waivers running through the end of 2025. It also temporarily removed certain fees on its International Board in Hong Kong to encourage cross-border trading. By lowering frictions, the exchange is improving liquidity and making arbitrage between Chinese and international markets more efficient. For global prices, this means fewer disruptive squeezes and steadier two-way flow, providing a stabilising influence after months of extreme volatility. In Q4, these reforms are likely to keep Chinese physical demand active despite high prices, helping to underpin the global market as Western investment shifts from aggressive accumulation to steady portfolio maintenance.
Q4 Outlook
We expect gold to consolidate within a broad $4,050–$4,350/oz range through the remainder of 2025. Persistent central-bank buying, ongoing ETF inflows and contained real yields provide a firm floor, while any renewed fiscal or policy uncertainty could trigger tests toward the upper end of the range. Overall, gold’s rally appears to be entering a mature, range-bound phase rather than reversing outright, with the metal likely to hold its ground near record territory into year-end.
Silver
Key Points
- Silver consolidates near $50/oz as policy support replaces pure speculative momentum.
- Supply remains tight, with a fifth consecutive annual deficit expected.
- Investor inflows stay strong, setting the stage for continued volatility.
Silver progresses through Q4 2025 on firmer footing than earlier in the year, consolidating near $50/oz after sharp swings in October. Its inclusion on the US Geological Survey’s 2025 Critical Minerals List has reinforced silver’s strategic importance to technologies such as solar panels, semiconductors and electric vehicles, while highlighting Washington’s push to secure key supply chains. ETF inflows have strengthened in recent weeks, signalling renewed investor confidence after the October consolidation. Taken together, these developments indicate that while speculative flows remain influential, the rally is increasingly underpinned by structural and strategic demand. In the forwards, the Tom Next spread has returned to contango, signalling easing prompt tightness, though a degree of caution persists further along the curve as banks remain wary following recent physical delivery strains.
On the demand side, the silver market stands at a crossroads. Investor interest and macroeconomic momentum have driven prices in recent months, but industrial demand continues to provide a firm base. Key sectors such as solar manufacturing and electronics remain steady consumers, though growth is gradual rather than rapid. Many refiners are still adjusting after the earlier physical squeeze and have yet to expand output meaningfully. The metal’s new critical-minerals status adds a strategic tailwind, opening scope for policy-driven stockpiling and domestic sourcing, particularly in the US. Overall, demand is strengthening but not yet fast enough to sustain a lasting breakout.
On the supply side, structural tightness remains a defining feature of the silver market. According to the Silver Institute, the global market is expected to record a fifth consecutive annual deficit in 2025. Above-ground stocks have continued to decline, while lease rates, although well below the extremes seen in October, remain elevated at around 5-6%, indicating that access to prompt metal remains constrained. Mine production has increased only modestly, and incremental output is being absorbed quickly, leaving little buffer against further drawdowns. The inclusion of silver on the US Critical Minerals List may, over time, support new investment and expedite permitting, but these effects are likely to materialise gradually rather than easing near-term tightness. In combination with strong investment inflows, this constrained supply backdrop continues to provide a firm underlying floor for prices, even if further sharp gains will require a fresh catalyst.
Investor flows and positioning remain central to silver’s direction. ETF holdings are expanding, and the market is shifting from momentum-driven rallies to a more balanced phase where fundamentals and flows align. Inflows have far outpaced those into gold, reflecting a broader investor base. Meanwhile, the move from backwardation to contango in short-dated forwards signals greater caution from banks and dealers, likely limiting near-term upside. Silver is no longer the short-squeeze trade it was earlier in the year, but is entering a steadier consolidation phase, although volatility may persist if positions become crowded.
Q4 Outlook:
We expect silver to trade between $48–$53/oz in a consolidation phase through Q4 2025, supported by strong investor interest and structural supply-demand dynamics, yet tempered by the absence of a clear industrial catalyst in the immediate term. Should a new trigger emerge, such as a supply disruption or government stockpile announcements, the metal could break new records. In short, silver’s next chapter appears more measured than the explosive rally earlier this year, with further upside contingent on new drivers rather than the momentum alone.
Platinum
Key Points
- Platinum remains one of 2025’s top performers, consolidating around $1,550/oz after its earlier rally as investors turn more cautious.
- Supply fundamentals remain supportive, with the market heading for a third consecutive deficit near 850 koz.
- Demand is stable but mixed, with stronger Chinese jewellery and investment interest offsetting auto-sector weakness, keeping prices range-bound between $1,450 – 1,650/oz.
Platinum heads deeper into Q4 2025 after a powerful rally earlier in the year, but prices have since eased back in line with gold, consolidating around $1,550/oz. The metal remains one of 2025’s top performers, up roughly 50% YTD, supported by earlier tightening in supply and renewed investor and jewellery demand, particularly from China. However, the market has shifted into a more measured phase, with ETF holdings softening slightly as investors take stock after the strong run-up.
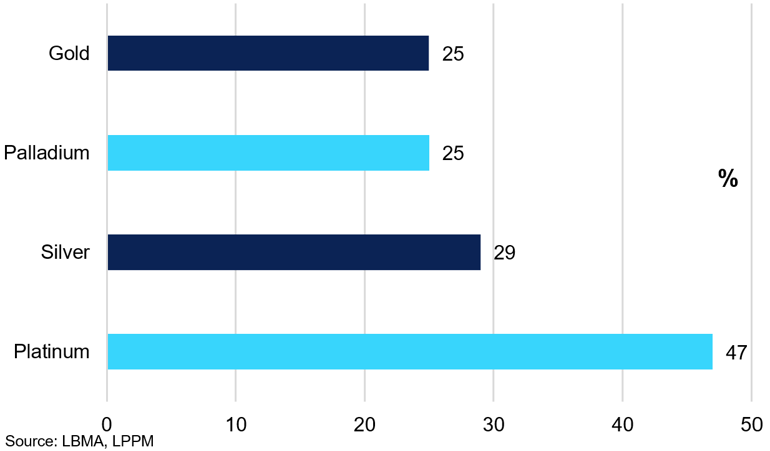
Precious metals Year-to-date performance, % (as of 10 nov 2025)
Platinum remains one of 2025’s top performers.
On the supply side, fundamentals remain supportive. According to the World Platinum Investment Council (WPIC) the market is projected to record a third consecutive annual deficit in 2025, with the shortfall pegged at around 850 koz. Mining output remains under pressure, led by South Africa where PGM production fell by around 3% YoY in early 2025 amid rising operating costs and ageing shafts. In North America, output growth has also slowed as producers face persistent labour shortages and cautious capital spending, which have limited production growth despite stronger prices. Above-ground stocks are also under pressure, with WPIC expecting inventories to fall to around 4 to 5 months of demand cover. Although much of the deficit appears to be priced in, the persistence of supply disruptions continues to provide a firm floor for the market.
Demand fundamentals present a mixed picture. Automotive catalyst demand remains under pressure as the diesel segment contracts and battery-electric vehicle penetration increases, with WPIC forecasting a modest 3 % contraction in automotive demand in 2025. By contrast, jewellery demand in China continues to build momentum. The WPIC forecasts that global platinum jewellery demand will increase by about 11 % in 2025, reaching roughly 2.23 Moz. Investment demand has also remained elevated, as many investors view platinum as a cheaper alternative to gold. The net result is a demand profile that is stable to mildly constructive, though the auto-sector headwinds cap the upside.
On positioning and market dynamics, flows remain a key driver. ETF holdings and net long positions built steadily through mid-year but have since levelled off, reflecting a more balanced speculative tone. Current ETF holdings stand near 3.15 million oz, while net positions remain positive but are off their recent highs. The market does not appear overstretched; yet, with prices elevated, volatility is likely to persist as investors reassess their direction.
Q4 Outlook:
We expect platinum to trade in a broadly supported but range-bound manner in Q4 2025, anchored by structural deficits and investment interest but tempered by demand headwinds and the fact that much of the supply risk is already in the price. Our base case predicts a range of $1,450–1,650/oz, with potential upside to $1,700–1,750/oz if a new supply shock (e.g., mine outage or South African infrastructure disruption) emerges. Conversely, if investment flows stall, the lower end of the range could trend back to $1,400/oz. Overall, we expect a consolidation phase rather than a swift continuation of the earlier rally.
Palladium
Key Points
- Palladium has mirrored platinum’s path in Q4, peaking in early October before consolidating around $1,400/oz.
- Demand remains soft, with rising EV penetration and substitution eroding autocatalyst use, leaving overall consumption stable to slightly lower YoY.
- Supply is steady and the market’s move into surplus is now expected in 2026, keeping prices range-bound between $1,300 – $1,550/oz through year-end.
Palladium has moved through Q4 2025 in step with platinum, rallying to its highest levels since 2023 in early October before consolidating around $1,400/oz. The broader strength in precious metals earlier in the quarter drew significant ETF inflows, lifting holdings above 1.0 Moz, while futures positioning remains net short despite some short covering. Sentiment has improved modestly, but investor engagement remains selective as the market digests the sharp rebound.
Speculative and investment flows remain key drivers of price stability. Earlier squeezes in the physical market have largely subsided, but fund inflows and tighter on-exchange spreads continue to lend support. ETF additions through September and October coincided with a rebound in sentiment across precious metals, aided by expectations of a softer dollar and looser US monetary conditions into year-end. Still, positioning remains light by historical standards, leaving the market vulnerable to sharp reversals if risk appetite fades or macroeconomic conditions become less supportive.
On the demand side, fundamentals remain constrained. Palladium’s primary application in petrol autocatalysts continues to face erosion from rising EV penetration and substitution toward platinum-rich formulations. Hybrid vehicle production is offering some offset, particularly in Europe and Japan, yet aggregate autocatalyst demand is expected to remain flat to slightly lower YoY. Industrial and electronics uses are steady but small in volume terms, while investment demand is improving only gradually. Overall, the demand backdrop into Q4 points to stabilisation rather than recovery, with no clear catalyst for a sustained structural upswing.
Supply conditions appear broadly stable, with mine output in South Africa and Russia, the two dominant producers, having normalised following last year’s disruptions. Recycling volumes have also improved as scrap collection rates strengthen. According to the World Platinum Investment Council (WPIC), palladium is still expected to move into surplus, although this transition has been postponed until 2026. Meanwhile the 2024 deficit has been revised higher by over 1 Moz to 1,281 koz. With inventories rebuilding and supply discipline largely maintained, the risk of near-term physical shortages remains limited. Without a significant supply shock, upward price momentum is likely to remain contained.
Q4 Outlook:
We expect palladium to trade in a volatile but range-bound manner through year-end, driven primarily by shifts in investor positioning and broader risk sentiment. We see prices consolidating within a $1,300–$1,550/oz band, with limited upside unless new supply disruptions emerge. In the absence of such catalysts, the market is likely to drift sideways into early 2026, supported by ETF demand but capped by structural headwinds in palladium’s core end-use sectors.

