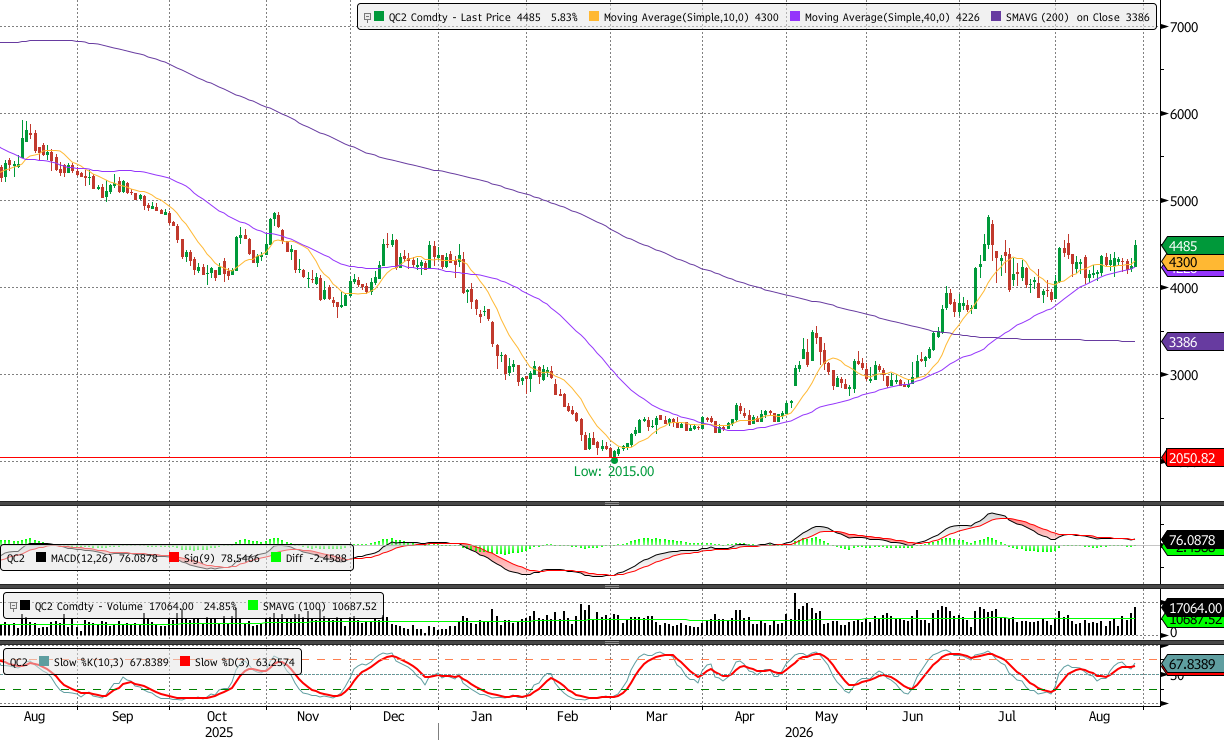
NY 2nd Month Sugar Futures
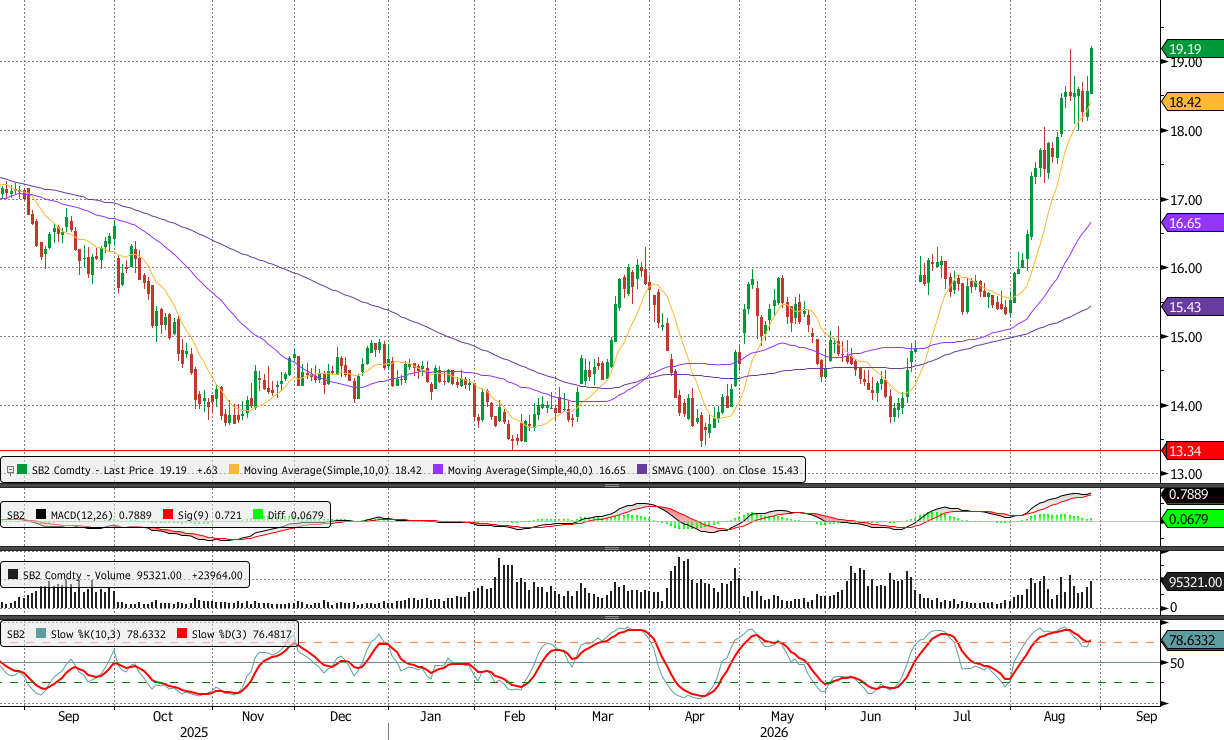
NY sugar futures rallied on Thursday as renewed buying pressure saw prices gain 0.63 and close at 19.19, the highest closing level visible on the chart. Futures recovered strongly from the recent pullback towards 18.20 and closed above the previous resistance at 19.00. The market remains comfortably above the 10 DMA at 18.42, while the 40 DMA at 16.65 and the 100 DMA at 15.43 continue to rise below current prices. This positive alignment of the moving averages maintains the broader bullish trend, although the widening distance between prices and the longer-term averages shows how sharply the market has advanced since mid-July.
The stochastics are rising, with %K/%D diverging on the upside at 78.63/76.48. The indicators have recovered from their recent decline and are approaching overbought territory again, signalling renewed buying momentum. The MACD diff remains positive at 0.0679, with the MACD line at 0.7889 above the signal line at 0.7210, confirming that the underlying bias remains constructive. However, the MACD diff has narrowed from its earlier peak, suggesting that momentum behind the broader rally is less pronounced despite Thursday’s strong advance.
To confirm the outlook for higher prices, futures need to hold above 19.00 and break above the recent intraday high around 19.20. A sustained close above this area could set the scene for a test of 19.50, before the psychological resistance at 20.00 comes into focus. On the downside, a failure to retain support above 19.00 could see prices return towards the 10 DMA at 18.42. A close below this average would weaken the immediate bullish structure and could trigger a deeper correction towards 18.00 and then 17.50.
Ldn 2nd Month Sugar Futures
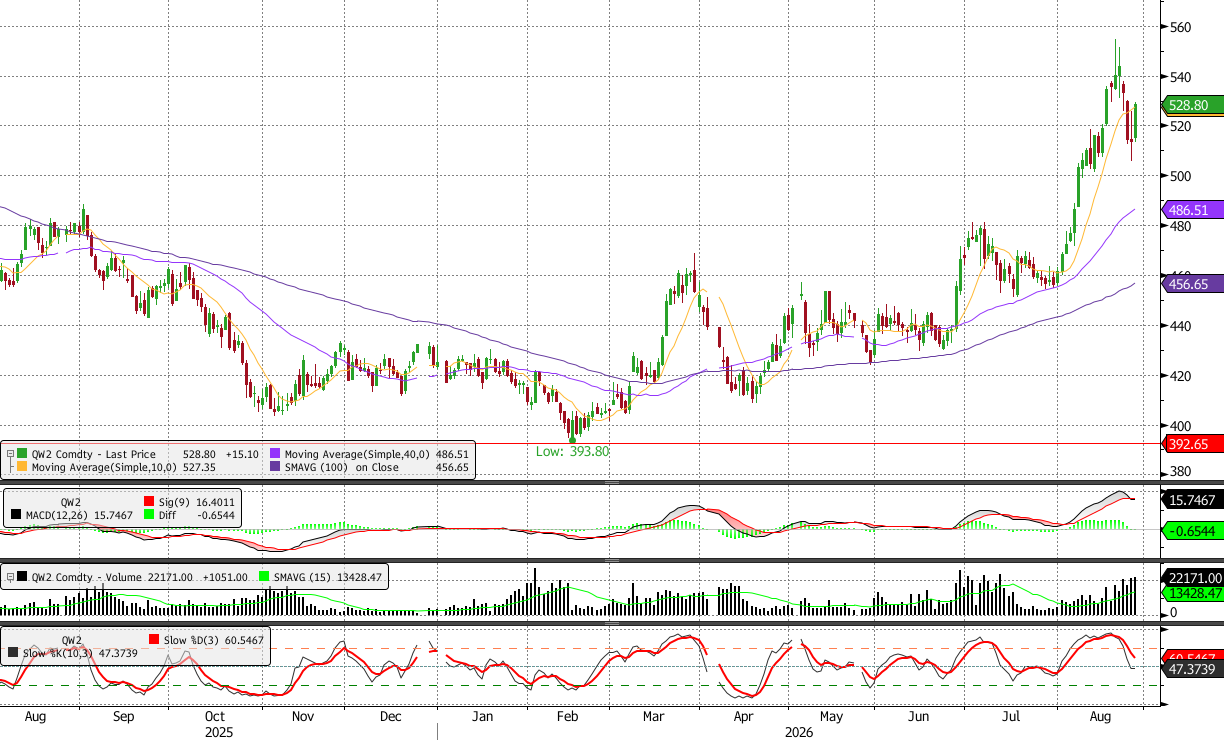
Ldn sugar futures rallied on Thursday as prices gained 15.10 and closed at 528.80, recovering strongly after the previous session’s sharp decline. Futures moved back above the 10 DMA at 527.35 at the close, although the market remains below the recent highs around 540–555. The 40 DMA at 486.51 and the 100 DMA at 456.65 continue to rise well below current prices, preserving the constructive medium-term moving-average structure. Nevertheless, the recent rejection from the August high and increased volatility show that the earlier bullish momentum has become less stable.
The stochastics are falling, with %K/%D at 47.37/60.55 and %K remaining below %D. This configuration signals continued downside momentum despite Thursday’s price recovery, although %K appears to be stabilising after its sharp fall from overbought territory. The MACD diff has converged on the downside and turned marginally negative at -0.6544, with the MACD line at 15.7467 below the signal line at 16.4011. This bearish crossover highlights a loss of upside momentum and suggests that Thursday’s rebound has not yet been confirmed by the broader indicators.
To confirm the outlook for higher prices, futures need to hold above the 10 DMA at 527.35 and break through resistance around 535–540. A close above 540 could set the scene for a renewed test of the August high around 555, with a break above this level required to restore the stronger bullish trend. On the downside, a failure to hold above the 10 DMA could trigger another test of support at 520. A close below 520 would reinforce the negative momentum indicators and could see prices return towards 500, before the 40 DMA at 486.51 comes into focus.
NY 2nd Month Coffee Futures
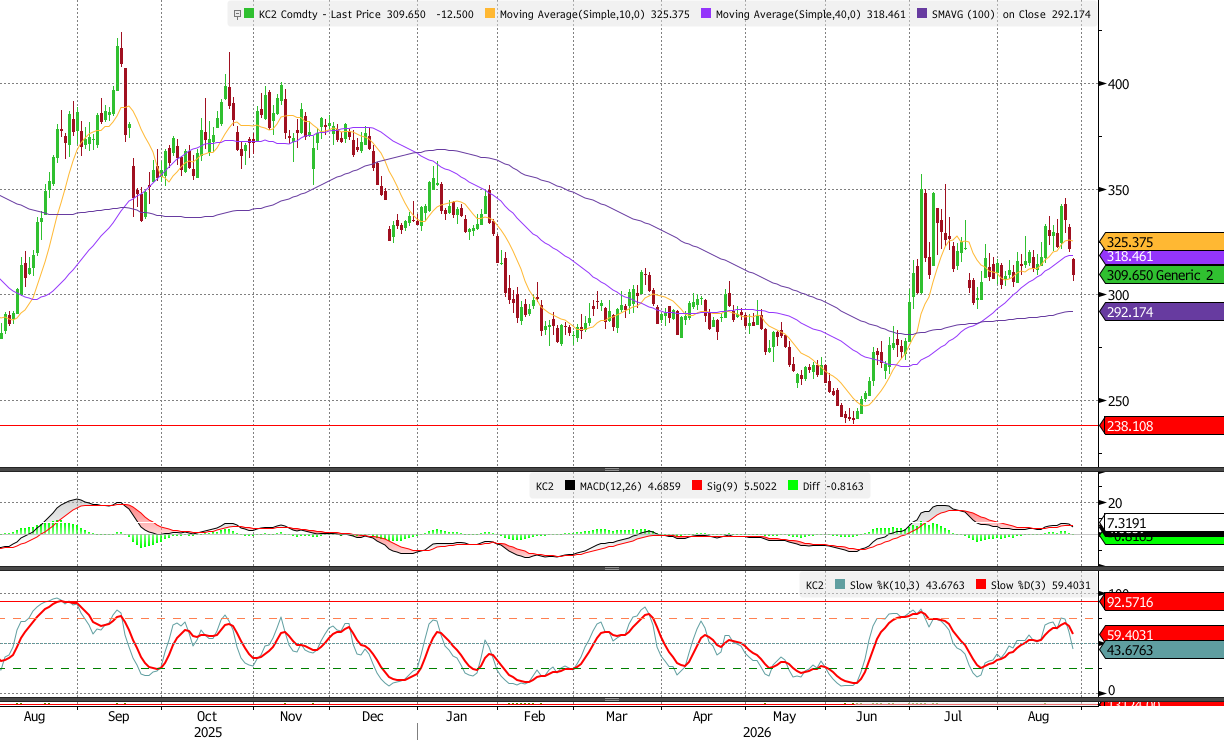
NY coffee futures fell sharply on Thursday as renewed selling pressure saw prices lose 12.50 and close at 309.65. The decline took futures below the 10 DMA at 325.38 and the 40 DMA at 318.46, reversing the constructive moving-average structure seen earlier in August. However, prices remain above the 300 level and the 100 DMA at 292.17, which now represent the main support levels protecting the broader recovery from the June low.
The stochastics are falling, with %K/%D diverging on the downside at 43.68/59.40, signalling strengthening bearish momentum after the recent rejection from the 335-340 area. The MACD diff has converged on the downside and turned negative at -0.82, with the MACD line at 4.69 below the signal line at 5.50, further highlighting the loss of buying pressure.
To confirm the outlook for lower prices, futures need to break below the psychological support at 300 and then take out the 100 DMA at 292.17. A close below these levels could set the scene for a deeper correction towards 280. On the upside, futures need to recover above the 40 DMA at 318.46 and then the 10 DMA at 325.38 to ease the immediate bearish pressure. A close above both moving averages could trigger another test of resistance around 335, before the recent high near 350 comes back into focus.
Lnd 2nd Month Coffee Futures
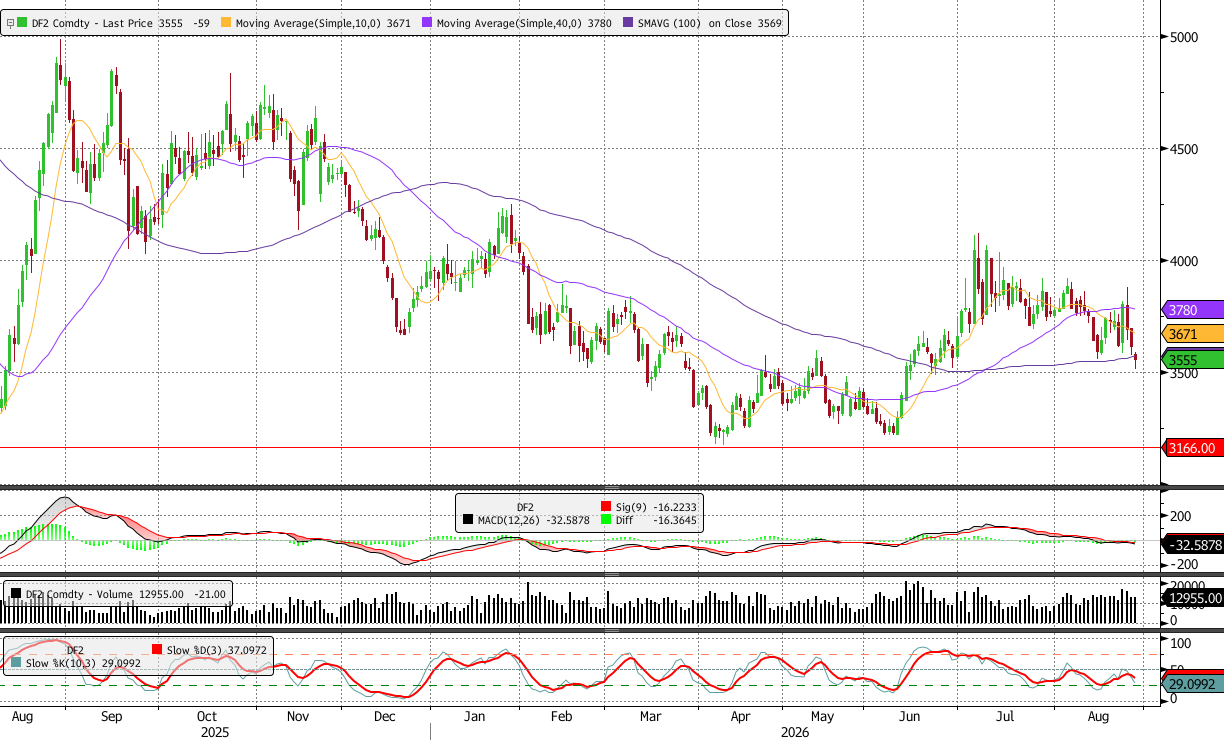
Ldn coffee futures weakened on Thursday as selling pressure saw prices lose 59 and close at 3555. Futures remained below the 10 DMA at 3671 and the 40 DMA at 3780, while the latest decline also pushed prices marginally below the 100 DMA at 3569. This break has weakened the technical structure and leaves the market testing the lower end of its recent trading range.
The stochastics are falling, with %K/%D diverging on the downside at 29.10/37.10, signalling continued bearish momentum as %K approaches oversold territory. The MACD diff is negative and diverging at -16.36, with the MACD line at -32.59 below the signal line at -16.22, highlighting growing selling pressure.
To confirm the outlook for lower prices, futures need to remain below the 100 DMA at 3569 and break through support at 3500. A close below this level could set the scene for a move towards 3400, before the longer-term support at 3166 comes into focus. On the upside, futures need to recover above the 100 DMA and then take out the 10 DMA at 3671 to ease the immediate downside pressure. A break above the 40 DMA at 3780 would be required to confirm a stronger recovery and could trigger a test of 3900.
NY 2nd Month Cocoa Futures
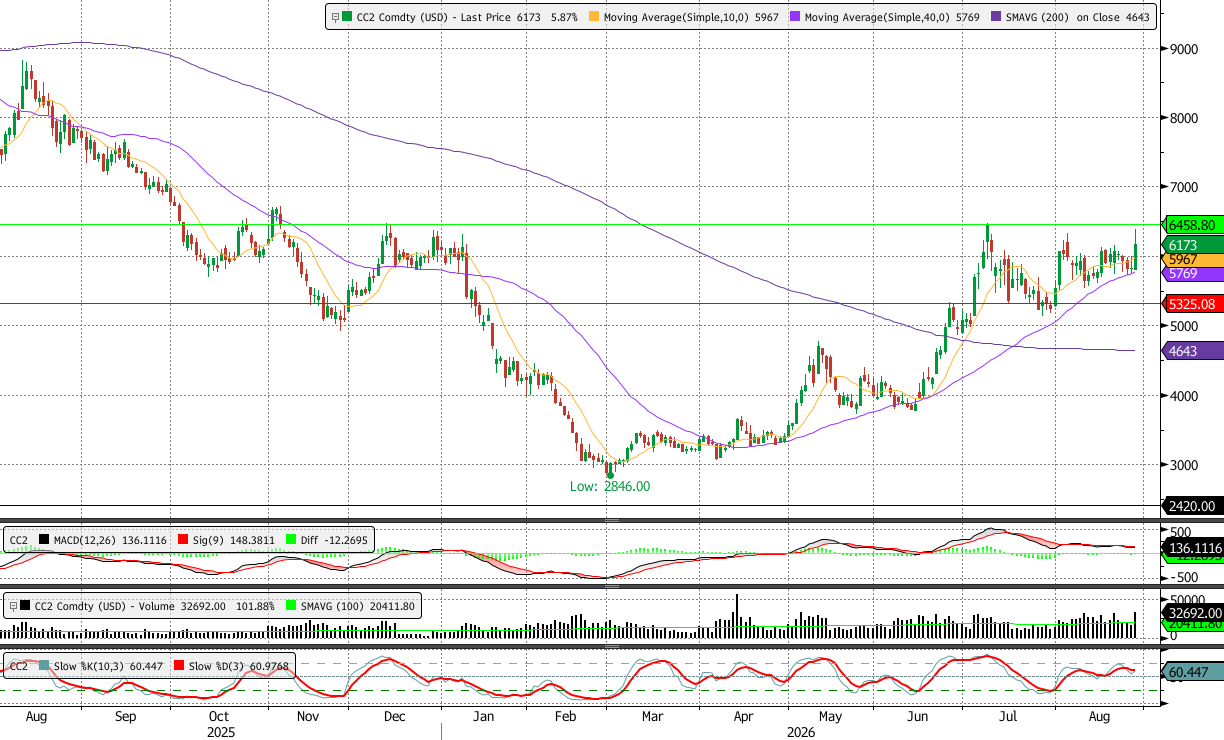
NY cocoa futures rallied on Friday as strong buying pressure saw prices gain 5.87% and close at 6173. The advance took futures decisively above the 10 DMA at 5967, while the 40 DMA at 5769 and the 200 DMA at 4643 remain below the market, maintaining the constructive moving-average structure. Nevertheless, prices remain within the broad 5325.08–6458.80 range that has contained the market since late June.
The stochastics have flattened, with %K/%D at 60.45/60.98, and %K remains marginally below %D despite Friday’s rally, suggesting that the improvement in momentum has yet to be fully confirmed. The MACD diff is negative at -12.27, with the MACD line at 136.11 below the signal line at 148.38, highlighting that the recent sideways momentum continues to weigh on the broader technical picture.
To confirm the outlook for higher prices, futures need to hold above 6000 and break through the robust resistance at 6458.80. A close above this level would complete an upside break from the recent range and could set the scene for a move towards 6700 and then 7000. On the downside, a failure to retain support above 6000 could trigger a test of the 10 DMA at 5967, followed by the 40 DMA at 5769. A break below both moving averages would weaken the recent recovery and bring the key support at 5325.08 back into focus.
Ldn 2nd Month Cocoa Futures