


Summary
As we move through Q2 2026, metals markets are increasingly defined by dispersion and individual metals' sentiment and fundamentals. The geopolitical shock that dominated the start of the year has been largely absorbed, with risk premia fading and price action becoming more selective across the complex. In place of uniform directional trends, markets are now differentiating more clearly between metals with genuine supply constraints and those facing surplus conditions or capped upside from policy and production responses.
Copper remains the central reference point for the complex, but its role has shifted. With conflict‑related volatility subsiding, copper is no longer transmitting sharp macro shocks across base metals. Instead, it is anchoring sentiment, allowing fundamentals, spreads and positioning to regain influence.
Elsewhere, localised supply risks are taking precedence over demand narratives. Aluminium and nickel are trading primarily as policy‑ and supply‑risk stories, tin remains highly sensitive to positioning in a thin market, while zinc and lead continue to lag under surplus fundamentals. With much of the geopolitical premium already priced in, liquidity and positioning are again the primary drivers of short‑term moves, leaving Q2 shaped by consolidation, headline sensitivity and micro‑level volatility rather than a renewed, coordinated trend.
Watch ouR Q2 Metals webinar
Aluminium
Aluminium entered Q2 underpinned by a very tight physical backdrop, with Middle East supply risks keeping global availability constrained. However, with the geopolitical premium largely priced in and demand only steady, prices are likely to stay range bound and driven by supply headlines rather than underlying consumption.
Copper
Copper has shifted into a new phase as conflict risk premia fade and macro headwinds ease. With volatility subsiding, fundamentals are beginning to reassert influence. Further upside will depend on the implementation of material security policies. Without such catalysts, copper is expected to remain resilient, exhibiting a cautious upward bias and showing diminished sensitivity to headline news.
Lead
Lead continues to lag the broader complex, reflecting muted liquidity and low speculative engagement. Expanding primary supply and patchy battery demand are keeping balances neutral, limiting follow through on rallies. The downside is prices remain range bound, well defended near $1,900/t and resistance firm around the $2,000–2,050/t area unless a clearer demand catalyst emerges.
Nickel
Nickel entered Q2 with a firmer policy driven floor as Indonesia tightens supply discipline and reinforces ore pricing, reducing downside risk without removing the structural surplus. Emerging sulphuric acid constraints add upside support but demand remains insufficient to drive a sustained rally. Nickel should stay supported but capped, with higher prices likely to attract fresh Indonesian supply approvals and producer hedging.
Tin
Tin has stabilised after a volatile Q1, with price action increasingly driven by positioning in a thin, liquidity constrained market. While recent inventory builds have eased prompt tightness, limited depth leaves the market vulnerable to renewed squeezes. Near term direction remains heavily dependent on supply outcomes in Indonesia and Myanmar, with risks still skewed toward episodes of re tightening.
Zinc
Zinc rebounded into Q2 as March’s inventory shock unwound, lifting prices back above key technical levels. However, the market remains flow and structure led, with expanding refined surpluses limiting the scope for sustained upside. Zinc is likely to trade choppily in the $3,000/t - $3,600/t range unless copper provides a stronger directional signal.
Gold
Gold remains structurally supported in Q2 but has failed to behave as a conventional safe haven, with oil led inflation pressures lifting yields and the dollar and capping upside. Strong central bank and investment demand continue to underpin prices, but act more as a floor than a fresh catalyst. Absent lower real yields or a weaker dollar, gold is likely to stay volatile but range bound in the near term.
Silver
Silver entered Q2 supported by persistent supply deficits and relatively light positioning, but price direction remains highly macro sensitive. While the structural backdrop limits downside, sustained upside still depends on renewed ETF inflows and a more supportive rates environment.
Platinum & Palladium
Platinum remains structurally supported by tightening physical balances and improving investor participation, reinforcing its relative strength. Palladium, by contrast, continues to trade as a more cyclical metal, with weaker long term demand visibility leaving it sentiment led.
Key Drivers
- Energy remains the main transmission channel: Markets have largely faded the geopolitical risk premium, with oil absorbing most of the impact. Freight disruptions are still seen as manageable, and physical metal flows remain relatively insulated from conflict headlines.
- Risk is delay, not collapse in demand: The near-term threat is postponed consumption and precautionary inventory behaviour rather than outright demand destruction. We watch spot premiums, order books, inventory drawdowns, scrap flows, and semi‑fabricator activity for confirmation.
- Inflation–growth tension keeps policy volatile: Rising energy CPI has pushed markets to price pre‑emptive ECB and BoE tightening, but this remains fragile. Each data print can swing expectations between inflation risks and growth concerns, sustaining volatility in the front-end of the curve.
- Duration matters more than direction: We expect that a prolonged conflict would keep the oil risk premium elevated, while metals increasingly trade on fundamentals. De‑escalation would support a softer dollar backdrop, which could give commodities a stronger boost.
Macroeconomic Outlook
World
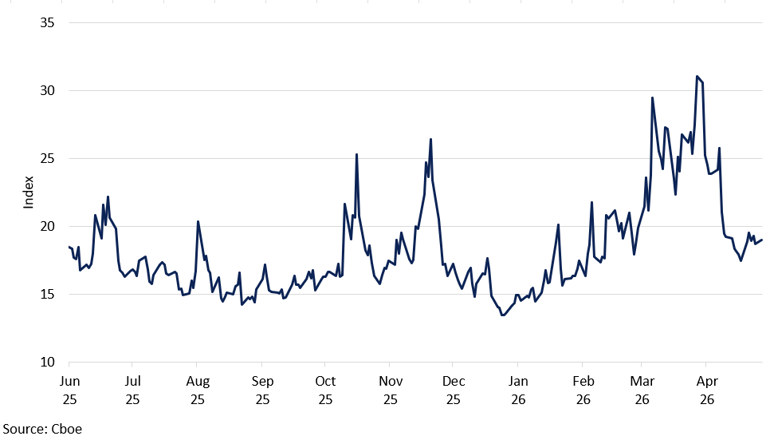
As we move through the second quarter, the global macro landscape remains shaped by the geopolitical themes that have dominated since the start of the year. The US–Iran conflict has now entered its third month, and headlines about shifting progress towards a truce continue to drive intraday price action across key asset classes. Oil, precious metals, and base metals have reacted strongly to changes in the geopolitical backdrop. Meanwhile, equity markets have largely disregarded these tensions: US stocks linger near record highs and the VIX index has retreated to pre-conflict levels, signalling that the market has effectively priced out the war risk premium.
This suggests that any resolution in the conflict could have a disproportionately large effect on commodities, given their sensitivity to supply chains, logistics, and the balance between supply and demand. With sentiment and positioning still driven heavily by headlines, the global macro outcome will depend on whether the disruption to oil supply is resolved or escalates further — and how these dynamic feeds into inflation versus demand. Until there is greater clarity, we anticipate persistently high cross-asset volatility and an underlying fragility in commodity assets.
US
The US macro narrative has been shaped more by politics and geopolitical influence than by outright economic fundamentals, as the Middle Eastern conflict has entered its third month. In particular, the economy has not been assessed in isolation, but rather by how insulated it is from energy shocks relative to its peers. Compared to Europe and parts of Asia, the US is less exposed to imported energy disruption, which improves its relative growth outlook when oil prices rise.
This relative energy resilience is driving the interest rate divergence between nations. The BoE and the ECB are expected to hike rates in the face of higher imported oil prices, whereas the Fed is expected to keep rates on hold for the remainder of the year. We expect that Warsh's incoming Fed Chair role is unlikely to shift this narrative, at least not in the first couple of months of the term, with a data-dependent stance likely similar to the outgoing approach.
VIX Index
Market volatility has subsided since the onset of the conflict, reflecting increasing fatigue with headline-driven news.
The data confirms a "steady but slowing" economy. The April jobs report (177,000 additions, unemployment steady at 4.2%) confirmed a solid but unexceptional pace, suggesting that the labour market is cooling gradually without collapsing. Meanwhile, pricing pressures confirmed a sharp energy pass-through, with headline inflation rising to 3.8% YoY. Crucially, while headline inflation has been pushed higher by surging energy costs, notably diesel, core inflation has remained comparatively stable, at 2.6%, indicating that the oil-driven price shock is tangible but has not yet materially curtailed consumers' ability to spend. The main macro risk for the US remains whether labour strength can continue to offset these residual inflationary pressures.
Overall, we believe that the US is in a better position to weather this conflict, especially if truce talks prove successful and the oil impact remains temporary without directly squeezing households. One important caveat, however: we believe that the dollar's current bid is fragile. Should the conflict end, the dovish expectations could re-emerge for the Fed. Combined with the removal of the modest safe-haven premium, this scenario could trigger a correction lower, which in turn would lift commodity prices. The principal risk from a US perspective, therefore, is less about domestic growth and more about the fragility of the dollar bid and any downside exposed by a return to more dovish pressures - or, conversely, by a resurgence of tariff rhetoric from the US side.
European Union
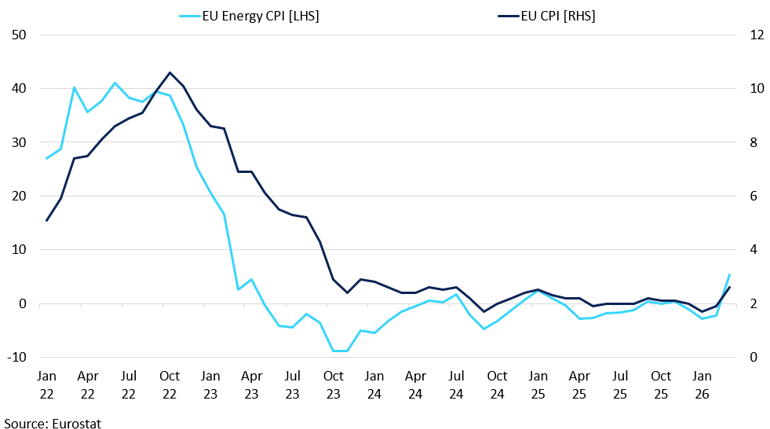
The EU's macro landscape has entered a precarious stage, caught between two opposing forces: rising energy-driven inflation versus concerns about weakening growth should interest rate hikes materialise. On the activity side, the eurozone economy remains under pressure: real GDP rose only 0.1% QoQ in Q1, while April's composite PMI fell to 48.8 and services dropped to 47.6, signalling renewed contraction. At the same time, headline inflation accelerated to 3.0% in April, driven by a 10.9% increase in energy prices, pushing EU energy CPI back to levels last recorded in January 2023. This combination of stalling growth and re-accelerating inflation places Europe precariously close to a stagflationary bind.
Markets currently price in approximately 60bps of tightening for the ECB, although for us, this appears pre-emptive. The repricing is anchored almost entirely in the immediate oil shock and the energy pass-through to headline inflation, rather than in demand-driven or broad-based price pressures. Should the Hormuz disruption prove short-lived or clear signs of demand softening emerge, these hikes could be rapidly priced out. The front-end of the curve is therefore extremely sensitive to narrative shifts: current rate-hike expectations rest on fragile assumptions, and any change in the conflict outlook or a run of weaker activity data could cause a sharp reversal.
EU Headline vs Energy Inflation YoY
Energy prices are re emerging as an upside risk for EU inflation.
We expect rate volatility to remain elevated, with each new data release interpreted as either supporting hikes (if inflation dominates) or cuts and delays (if growth falters), keeping the front end and the curve notably choppy. The trajectory for rate hikes will depend heavily on the duration and severity of disruptions in the Strait of Hormuz; if hikes do materialise, we believe they are more likely to be pushed later into the year. The eurozone's disproportionate energy import dependence means that the stakes for European macro are the highest of any region in a sustained conflict scenario, while also offering the most relief if a credible resolution emerges. In the latter case, European rate-hike repricing may ease significantly, potentially shifting the regional narrative from inflation risk back toward growth support.
China
China's economy delivered a stronger-than-expected start to 2026, but the headline figures mask persistent structural fragility beneath the surface. Q1 GDP grew 5.0% year-on-year — 0.5 percentage points faster than Q4 2025's 4.5%. However, growth remains unevenly distributed across the economy. Manufacturing expanded 6.3% YoY, with information technology services (+10.6%) and leasing and business services (+12.2%) leading the tertiary sector, reinforcing the narrative that technology and higher-value services are gradually replacing traditional industry as growth engines. In contrast, construction contracted 3.8% and real estate declined 0.1%, confirming that the property sector remains a structural drag.
The external picture adds complexity. China's trade surplus reached $1 trillion by November 2025, underscoring how much growth leans on external demand. The US–China trade truce lasts only until November 2026, and renewed trade tensions remain a material risk. The growth outlook has been tempered accordingly. Consensus growth is settling in the mid-to-high 4% range, down from the "around 5%" target that was met in 2025. By lowering the target by 2026 to 4.5% and by implying less fiscal stimulus support approach, we believe that policymakers are allowing the economy to mature into a structurally slower phase.
Meanwhile, China’s yuan continues to appreciate gradually in 2026, supported by a historically softer dollar, a large trade surplus and steady export inflows, but Beijing remains firmly focused on controlling the pace. As a result, policy aims to balance modest appreciation that supports imports and longer term internationalisation against the need to protect export competitiveness and financial stability. The base case remains a controlled, moderate appreciation bias rather than a sharp rally, with periodic upside capped by active FX management.
Emerging Markets (EM)
Oil remains the central transmission channel into EM risk. As long as Brent stays elevated, energy-importing EMs face outsized inflation and FX pressures. The divergence between equities pricing resilience and oil pricing persistent disruption leaves EM markets particularly vulnerable to a repricing if central banks push back against easing expectations.
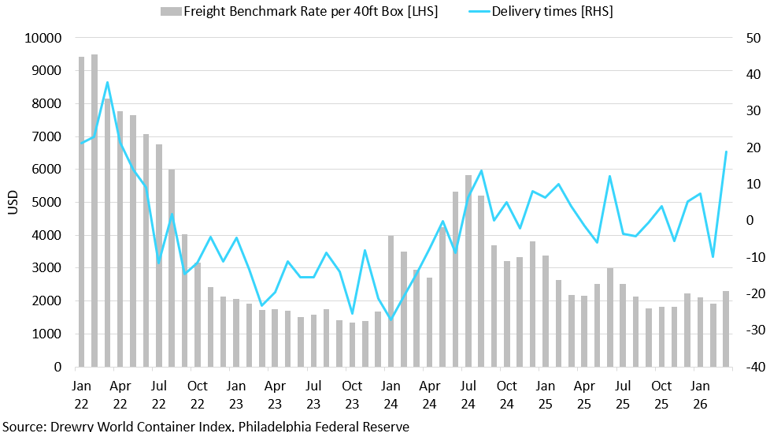
Global Shipping Freight Rates vs Delivery Times
Freight rates remain well below the 2022 peak, but volatile delivery times underline renewed fragility in shipping routes amid ongoing Middle East disruption risks.
EMFX recovered alongside the ceasefire narrative, but this recovery remains fragile and headline-dependent. Even a military de-escalation will not immediately relieve EM from energy-driven inflation pressures. Disrupted shipping routes, higher insurance costs, and rerouted trade flows around the Strait of Hormuz could keep energy prices structurally elevated and inflation risks persistent for longer, regardless of the outcome. For energy-importing EMs, this means that even under a benign ceasefire scenario, the relief on trade balances and consumer-price inflation may be slower and more incomplete than spot oil prices alone would suggest. We expect that until energy volatility stabilises, EM outperformance will likely remain constrained, and positioning will stay headline-dependent.
Oil
Oil entered Q2 with geopolitical disruption still firmly embedded in the market. Despite ongoing negotiations between the US and Iran, flows through the Strait remain heavily constrained, keeping a meaningful disruption premium embedded in the market.
We see the market shifting away from panic pricing and towards a phase of persistent but manageable tightness. Gulf producers are increasingly rerouting exports through alternative routes, while buyers adapt sourcing patterns to manage ongoing disruption. This should limit the likelihood of an extreme supply shock unless the conflict escalates further.
At the same time, elevated oil prices are feeding directly into the broader macro environment. Higher prices continue to support inflation expectations, prevent yields from falling meaningfully and underpin the dollar through relative growth dynamics, particularly against more energy-exposed economies such as Europe.
We expect Brent to trade broadly within a $95–115/bbl range in Q2. Upside should remain supported by ongoing logistical disruption and limited spare transport flexibility, while prices above $110/bbl increasingly raise demand destruction and growth concerns, making sustained moves higher harder to maintain. Overall, we expect oil to remain well supported in Q2, with the market increasingly driven by how quickly disrupted flows can normalise rather than by fears of an outright supply collapse.
Aluminium

Key Points
- Aluminium enters Q2 with one of the tightest physical balances in base metals, driven by Middle East supply disruption risks.
- Low inventories and constrained seaborne availability are supporting prices, but the geopolitical premium is largely priced in.
- As a result, aluminium is likely to trade range bound, with price direction tied more to supply headlines than demand strength.
Aluminium enters Q2 2026 with one of the tightest physical setups across the base metals complex, driven primarily by escalating supply risks in the Middle East. What was initially perceived as a geopolitical tail risk has now translated into tangible disruption across smelter operations and seaborne availability. The region accounts for 9.2% of global aluminium production, but its importance is amplified by its outsized role in exportable metal, making it critical for import-dependent regions. As a result, even partial disruption has a disproportionate impact on global availability and pricing dynamics. Should disruptions persist, the market could move into a deficit of around 2Mt by year-end, signalling a material tightening relative to previous forecasts and reinforcing the sensitivity of prices to further supply shocks.
Aluminium LME vs SHFE Stocks
LME aluminium stocks remain historically tight versus more comfortable Chinese inventories, highlighting the imbalance in global availability.
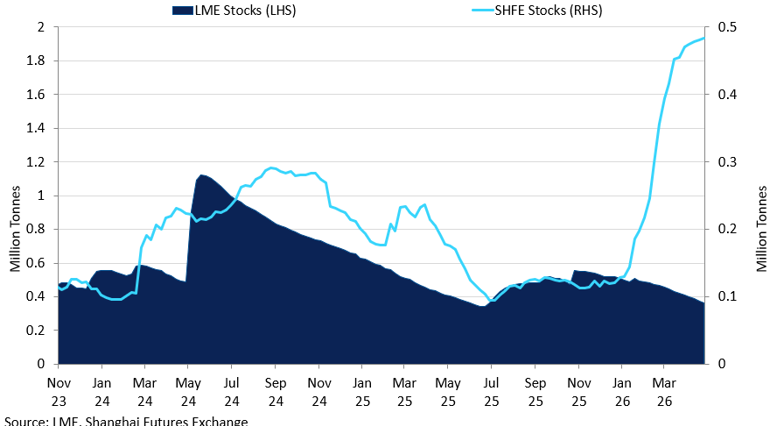
The clearest signal of the tightening remains the physical market. While SHFE prices indicate that China remains relatively well supplied, conditions outside China are much tighter. Seaborne availability has become increasingly constrained, driving premiums sharply higher in key import markets. Japanese Q2 premiums have risen to $350–353/t, the highest level in over a decade, reflecting buyers’ willingness to pay for security of supply. At the same time, LME inventories have declined to below 400kt, reinforcing the lack of readily available metal in the system. This tightness has also been reflected in persistent cash-to-three-month backwardation, which widened to around $80/t at peak tension, highlighting acute nearby scarcity. However, the backwardation has shown sensitivity to geopolitical headlines, narrowing at times of perceived de-escalation, underscoring the market’s reliance on evolving supply risk narratives and short-term sentiment shifts.
Despite these supportive fundamentals, current aluminium prices suggest that the disruption risk is already reflected, with recent price action struggling to extend meaningfully higher and repeated failures to sustain moves above the $3,600–3,650/t range. This indicates that the current price level largely reflects the scale of Middle East supply risk, leaving limited room for further upside without an additional supply shock. At the same time, demand conditions remain steady but not strong enough to independently drive prices higher, particularly with global industrial activity showing only moderate growth and limited signs of a strong cyclical rebound. As a result, aluminium is increasingly trading as a supply-risk premium story rather than a demand-led one, with price direction closely tied to geopolitical developments and shifts in physical availability.
Q2 Outlook:
We expect aluminium to remain well supported in Q2, underpinned by ongoing Middle East supply risks. However, upside is likely to remain capped as the geopolitical premium is already priced in. We expect prices to trade within a broad $3,450–3,650/t range, with resistance continuing to emerge around $3,675/t as rallies attract profit-taking and producer selling. Overall, aluminium has already transitioned into a more two-sided market, with risks gradually shifting from further upside extension towards downside correction as geopolitical uncertainty stabilises and supply conditions begin to normalise.
Copper

Key points
- As macro-driven narratives fade into background noise, copper is increasingly influenced by shifts in its own fundamentals.
- Upside catalysts now hinge on material security policies, including US stockpiling initiatives or renewed tariff risk.
- We anticipate a cautiously bullish narrative, underpinned by COMEX-driven flows.
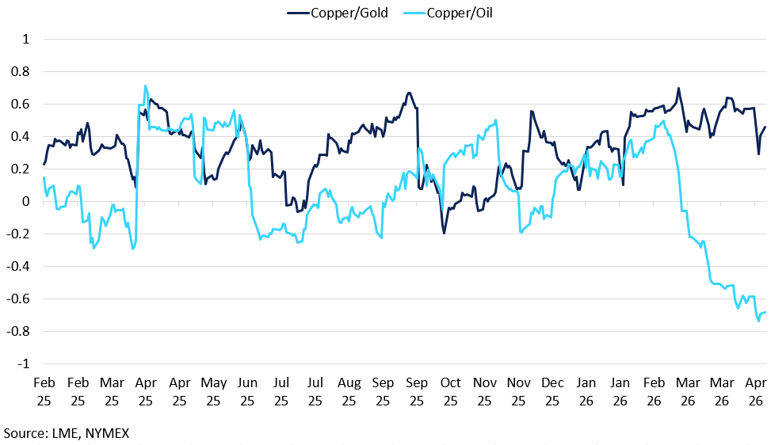
Copper started the year as a macro-driven metal. As conflict headlines dominated, the flat price was set more by cross-asset positioning and risk interpretation than by copper fundamentals. The inverse relationship with oil likely reflected markets treating higher oil as a tax on global growth and manufacturing, and therefore a headwind for copper. In other words, copper was priced less as a pure “growth metal” and more through risk sentiment and headline-led flows. As the conflict premium receded, copper transitioned from short-term directional swings to sentiment-driven price discovery, with strong support emerging at $13,200/t. Now that prices have surpassed the key technical level of $13,600/t, we see greater potential for further gains. While the current break above $14,000/t appears unsustainable in the short term, prices could return to this level by the end of the quarter. Options markets reflect this, with implied volatility declining from ~34% in January to ~28%. In short, copper now reacts to headlines in the short term, but the market is no longer paying a premium for medium-term protection as it did during the initial shock phase.
Rolling Correlation on Daily Returns: Copper vs Gold and Oil
Copper pricing has shifted from growth led signals toward macro and energy driven dynamics.
We are now entering a stage where macro factors are increasingly regarded as background noise, while fundamental anchors are resurfacing. With macro no longer providing a clear directional signal, the market’s focus is shifting back to location spreads, exchange inventories, physical premiums, Chinese demand, and production constraints. As a result, markets are beginning to look ahead for new potential catalysts. A particularly compelling theme, one that did not disappear in 2025 and is likely to re-emerge in 2026, is material security. Several key trends continue to underpin this narrative.
The push for US copper stockpiling reflects a growing “materials security” mindset: the US is dependent on imported refined copper—USGS estimates net import reliance rose to 57% of apparent consumption in 2025, and refined copper accounts for about 88% of unmanufactured copper imports. Against this backdrop, “Project Vault” can be viewed as a demand-driven approach to resilience: it aims to protect US businesses from shortages and cushion manufacturers from supply disruptions, in part responding to the administration’s concern about China’s influence over critical mineral pricing and supply.
Another lever to incentivise greater material imports is the threat of tariffs. Tariff risk became central to the stockpiling narrative as it encouraged copper to be brought into the US ahead of any policy changes. In 2025, the market saw copper tariffs implemented, though the result was less severe than initially feared: the White House proclamation of a 50% tariff on semi-finished copper products and copper-intensive derivatives, while explicitly excluding key input materials such as ores, concentrates, and cathodes. This clarification alleviated concerns over tariffs directly constraining raw-material feed and was a major factor in the collapse of the premium following the announcement.
Q2 Outlook:
Copper appears to be shifting from a period dominated by macro-driven flows to one increasingly shaped by fundamental factors. While headlines can still influence intraday price movements, overall volatility is likely to remain more subdued than during the initial stages of the conflict, resulting in resilient price outlook unless a clear fundamental catalyst emerges. A renewed wave of US protectionist policy could spur higher inflows into US inventories. This, in turn, would support a more bullish narrative for COMEX prices and potentially strengthen the LME price outlook.
Lead

Key points
- Lead has stabilised after March weakness but continues to lag zinc, reflecting muted liquidity and lower speculative interest.
- Expanding primary supply and patchy battery demand are keeping the market broadly balanced with surplus conditions building.
- Prices remain range bound, with strong support near $1,900/t and resistance firm around the $2,000–2,050/t area.
Lead prices fell alongside the broader metals complex in March, temporarily breaking below the $1,950–2,100/t range that had held since spring 2025. By April, lead had recovered to just above $1,950/t, though its rebound was less pronounced than zinc’s. This muted response is consistent with a long-standing pattern: lead tracks zinc's direction but with smaller amplitude, owing to lower speculative participation and flatter underlying fundamentals.
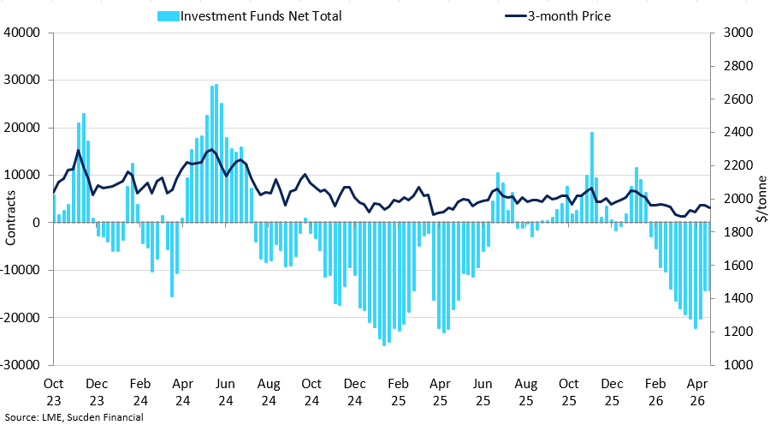
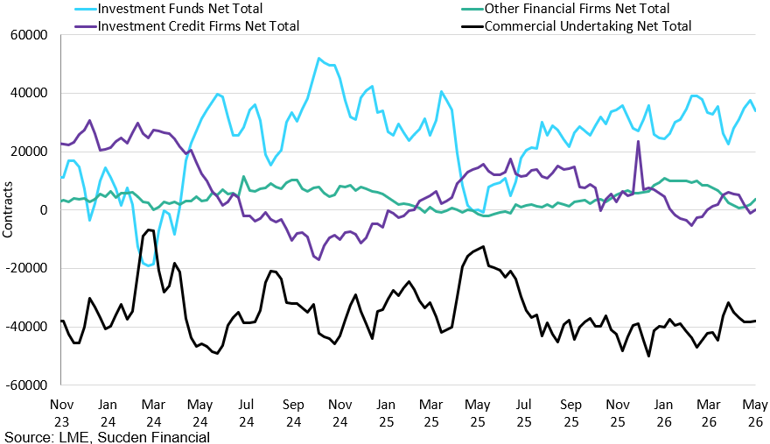
LME COT Lead Investment Funds Total vs Change vs 3-month Price
Muted spec interest anchors lead in a narrow band post-March.
Fundamental conditions remain largely unchanged. As of Q1 2026, China’s primary lead smelting capacity continued to expand, with several new projects coming online and ramping up production. Secondary supply, however, remained subdued, with many recycling facilities operated below capacity due to weak margins and stricter environmental controls, mirroring the softness seen at the end of 2025. On the demand side, battery manufacturing activity was patchy. SMM reported that operating rates at battery producers dipped further in Q1, as some manufacturers reduced output in response to sluggish domestic and export demand. This softer demand backdrop, combined with an expanding global surplus - ILZSG projected the 2025 surplus to nearly double from 63,000 tonnes to 121,000 tonnes - has left the market balanced at best, with limited scope for a sustained directional break. Lead also carries the lowest strategic-supply vulnerability among the base metals in a US context, making it less likely prone to supply-driven squeezes.
Options flows have reinforced the subdued environment. Persistent selling of put options at strikes below $1,900/t expiring in calendar 2026 signals that market participants view that level as a credible floor and are willing to underwrite the downside. This steady supply of protection has suppressed implied volatility, aligning with an extremely low realised-volatility backdrop: 30-day realised vol has hovered around 10–15%. With both measures pinned near December 2025 lows, this further discourages speculative engagement in a market that already has one of the lowest levels of investment-fund participation in the complex, second only to tin.
Positioning paints a similarly constrained picture. Investment funds extended short positions during the March sell-off, adding mechanical downward pressure. Some of that pressure eased in April through partial short-covering, aided by brief tightness in the expiring LME contract around the roll period. However, any nascent rally quickly met resistance from commercial hedgers selling forward into price strength, effectively capping gains near $2,000/t.
Q2 Outlook:
Lead is more likely to continue tracking copper and zinc loosely rather than charting an independent path. Given our base-case view that broader base metal prices will remain resilient with a cautiously upward bias, lead should follow a similar pattern, albeit with tempered magnitude. There is room for a partial recovery if the complex firms, but resistance at ~$2,050/t appears well-established for now. Conversely, the $1,900/t level looks increasingly defended via options positioning, suggesting that downside below that mark—while possible in a severe risk-off episode - would likely attract buying interest and prove short-lived.
Nickel

Key Points
- Indonesian policy is tightening supply discipline, reinforcing a firmer price floor but not eliminating the structural surplus.
- Sulphuric acid shortages pose a new constraint on HPAL output, tightening battery grade nickel supply at the margin.
- Upside should remain capped, as higher prices risk triggering fresh Indonesian supply approvals and producer hedging.
Nickel’s Q2 2026 outlook is shaped by Indonesia’s attempt to manage both volumes and pricing. The government has reduced 2026 nickel ore quotas, with national allowances estimated at around 260–270Mt compared to 379Mt in 2025, alongside cuts to approvals for major producers. Weda Bay’s 2026 permit, for example, was cut to 12Mt from 42Mt in 2025, highlighting Jakarta’s stricter control over supply. This does not remove the structural surplus created by Indonesia’s rapid capacity expansion, but it reduces downside risk versus last year and increases the credibility of a policy-driven floor. It also signals a shift in policy focus towards price stability rather than maximising output growth. Indonesia has also shortened mining quota validity to one year, giving the government more frequent control over output, while revisions to the domestic benchmark pricing system strengthen ore-price discipline and reduce pressure on miners to maximise volumes at weak prices. Together, these measures point to a more active policy framework, with supply increasingly managed in line with market conditions.
China’s Sulphuric Acid Export Destinations
Indonesia’s reliance on Chinese sulphuric acid highlights its vulnerability to export curbs that could constrain battery grade nickel supply.
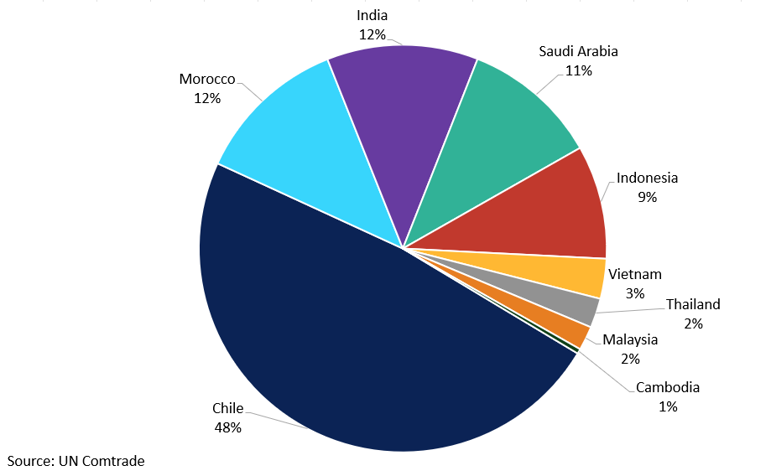
At the same time, sulphuric acid has become a major second-order supply risk. China, the world’s largest sulphuric acid producer, has moved to halt exports from May after introducing quotas earlier this year, with domestic fertiliser demand a key priority. This matters for nickel because HPAL, or high-pressure acid leaching, relies on sulphuric acid to extract nickel from laterite ores for battery-grade production. This is increasingly relevant given the rapid expansion of HPAL capacity, particularly within Indonesia’s battery value chain, where it is driving a growing share of battery-grade nickel supply. Indonesia is particularly exposed because it relies on the Middle East for around 75% of its sulphur imports, while stockpiles may only cover one to two months. If disruptions persist, the acid story could shift from margin pressure into a genuine production constraint for battery nickel, tightening supply at the margin.
The upside, however, is still likely to be capped. Indonesian policy support is conditional: Jakarta has signalled it can adjust production allowances if prices strengthen, meaning policy acts as both a floor and a cap. This is important because a rally towards $20,000/t would likely increase the risk of additional RKAB approvals, while higher prices could also encourage producer hedging, adding a market-based layer of resistance. In this context, price strength itself becomes a trigger for additional supply, limiting the sustainability of upward moves. Demand growth remains insufficient to absorb supply on its own, with stainless demand still uneven and battery demand increasingly influenced by LFP substitution. As a result, we see the Q2 price path being driven primarily by Indonesian policy signals and acid availability, with demand playing a more limited role.
Q2 Outlook:
We expect nickel to remain supported at higher levels in Q2, but upside is likely to remain capped. Lower Indonesian quotas and tighter ore pricing are reinforcing a firmer floor around $18,000/t, further supported by sulphuric acid constraints and higher HPAL costs. However, gains are expected to become harder to sustain as prices move towards the $20,000/t, where the risk of additional Indonesian supply approvals and increased producer hedging rises.
Tin

Key Points
- Tin prices recovered after Q1 volatility, with price action driven more by positioning than physical fundamentals.
- Thin liquidity and shifting investor participation have amplified volatility and left the market prone to renewed squeezes.
- Near-term direction hinges on supply developments in Indonesia and Myanmar, with risks still skewed toward re tightening.
After a volatile Q1, tin prices recovered in early May, trading around the $55,000/t level. The moves broadly matched our expectations: price action became increasingly detached from physical signals and was instead dominated by positioning in a relatively small, liquidity-sensitive market. Prices rallied in January as SHFE-driven activity set the tone for sentiment, and February’s continuation looked more speculative than fundamentally led, with profit-taking capping follow-through.
LME Tin Cash to 3M and 15M Spreads
Tin’s prompt tightness has eased, with spreads shifting from backwardation into contango as supply pressures temporarily relax.
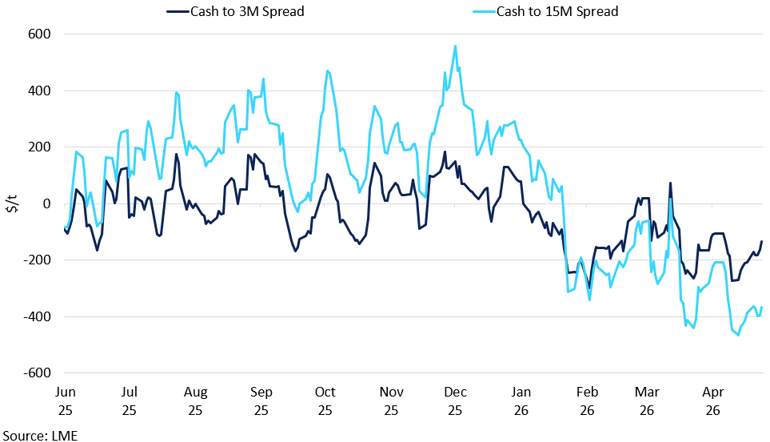
COT data highlights the shift in market structure: investment fund net length flattened even as prices rose, breaking the relationship seen since early 2025. At the same time, greater participation from investment and credit players alongside reduced commercial short positioning suggests the rally was propelled by shorter-horizon capital while traditional liquidity providers had stepped back. With hedgers and systematic funds less active, depth deteriorated, and relatively small flows had an outsized impact, amplifying intraday volatility. This also showed up in spreads: nearby tightness briefly re-emerged, pushing the prompt structure back into sharp backwardation before reversing as the market unwound and the curve moved into contango. That easing helps explain the recent stabilisation, but it also leaves the market structurally prone to renewed squeezes if positioning shifts again.
The key swing factor is supply, particularly from Indonesia and Myanmar. In Indonesia, the shift in RKAB approvals from a three-year to a one-year cycle from 2026 forced Q1 re-submissions and temporarily slowed exports. Myanmar remains a two-way risk: concentrate shipments may continue to recover, with scenarios suggesting Wa metal-in-concentrate could trend toward ~1.5–2.0 kt/month (and potentially ~2.0–3.0 kt/month if dewatering improves), but the market has repeatedly repriced on “restart” headlines that fail to translate into arrivals. Against this backdrop, sustained low treatment charges, sub-normal smelter operating rates, and short raw-material cover remain the standard warning signs that a refined output gap is forming.
Absent fresh supply shocks, the near-term setup is consistent with Q1 2026 pattern as recent tightness has been partially alleviated by inventory builds. LME tin stocks rose into early March to around 9,000 tonnes and have broadly stabilised near that level, marking the highest inventories since January 2015. Even with higher visible stocks, the concentration of supply and the market’s thin liquidity mean the potential for renewed prompt tightness remains elevated if flows from key producing nations disappoint.
Q2 Outlook:
Given current positioning and curve dynamics, we see risks as tilted toward bouts of re-tightening rather than a sharp, sustained price correction: consistent with the pattern observed in early May. With demand swings likely to play a smaller role in near-term price discovery, the Q2 narrative should be driven mainly by supply developments in key producing nations. We believe the market is more likely to price shortage risk more aggressively, leaving tin vulnerable to outsized moves on relatively small shifts in sentiment in what remains a thin and illiquid market.
Zinc

Key Points
- Zinc rebounded into Q2 as March’s inventory driven shock unwound, stabilising prices back above key technical levels.
- The market remains flow and structure led, with surplus fundamentals limiting the sustainability of the upside.
- Zinc is likely to trade choppily, with support near $3,000/t and resistance firm around the $3,550/t area.
Zinc started Q2 on a firm footing, rebounding from its March drop as both macro sentiment and market structure improved. After declining by approximately 10% in March amid a copper-led selloff, zinc rallied through May to briefly revisit its January highs around $3,530/t. The March decline was triggered initially by macro factors — notably, copper's retreat as it traded in strong negative correlation with oil and the dollar. Zinc's drop overshot copper's, however, because of a simultaneous structural shock: in mid-March, more than 20,000 tonnes of zinc were delivered into LME warehouses over two days, predominantly as on-warrant metal in Asian depots. This sudden influx punctured any lingering perception of physical tightness and sent the cash–3M spread into its deepest contango since March 2025, confirming that the exchange suddenly had ample nearby supply.
LME COT Zinc Net Totals
Zinc's price action continues to be distinctly flow- and structure-led.
We believe that the nature of the March inventory shock was financial rather than consumption-driven. The speed, location, and on-warrant registration of the deliveries are consistent with a large trading intermediary depositing off-exchange surplus metal into the LME. The subsequent April reversal, a sharp but temporary spike in cancelled warrants in Asian warehouses suggests much of that metal was later re-routed out of the system.
By early May, LME zinc inventories had reverted to their pre-spike levels, and prices stabilised around $3,300/t, back above the technical trendline dating from the March 2025 trough. Cash-to-3M spreads, while still in contango, had tightened from the March wides — a sign that the excess nearby supply was clearing. This could allow zinc to regain upward momentum, positioning the market for a potential test of the $3,550–$3,575/t resistance band.
The fundamental backdrop remains soft. Global refined zinc production continues to outpace demand growth, with surpluses projected at 125,000 tonnes in 2025, doubling to 330,000 tonnes in 2026. China is the key driver: Chinese zinc concentrate output is expected to rise by nearly 200,000 tonnes (metal content) in 2026, accounting for more than 65% of this year's supply growth. We believe that zinc's price action continues to be distinctly flow- and structure-led rather than by any clean fundamental trend, with copper remaining the primary directional indicator for short-term moves.
Q2 Outlook:
Zinc appears poised to trade in a choppy fashion, dependent on external cues and stock-flow dynamics. On one hand, supportive macro sentiment or a continued drawdown in LME stocks could foster pockets of tightness and support prices. On the other, the risk of another inventory surprise lingers: LME zinc stocks have not sustainably fallen below approximately 94,800 tonnes since December, suggesting that whenever the market tightens, metal finds its way back onto the exchange. A material break above ~$3,500/t would likely require either a significant copper rally or a genuine physical supply disruption. Conversely, the $3,000/t area should attract buying interest, providing a floor.
Gold

Key Points
- Gold has failed to act as a Q2 safe haven as Middle East risk has fed into oil, lifting inflation expectations, the dollar and yields, and limiting upside.
- Structural demand remains strong but acts as a floor rather than a fresh upside driver.
- Meaningful upside requires lower real yields and a weaker dollar, leaving gold volatile but constrained in the near term.
Gold is not behaving as a traditional safe haven in Q2. The latest Middle East escalation failed to trigger a sustained defensive rotation into bullion, with the shock instead transmitted primarily through energy markets. Higher oil prices have lifted inflation expectations, supported the dollar and kept Treasury yields elevated, increasing the opportunity cost of holding a zero-yielding asset. This helps explain why spot gold has struggled to sustain upside momentum despite ongoing geopolitical stress. The recent price action resembles the early stages of the Russia–Ukraine conflict, when gold initially benefited from geopolitical uncertainty before giving back gains as energy inflation, dollar strength and tighter financial conditions became the dominant macro drivers. The inverse correlation between gold and the dollar has strengthened again in recent months, reinforcing the extent to which macro and currency dynamics are dominating price action.
Gold Spot vs US 10Y Treasury Yield
Elevated US yields continue to cap gold’s upside.
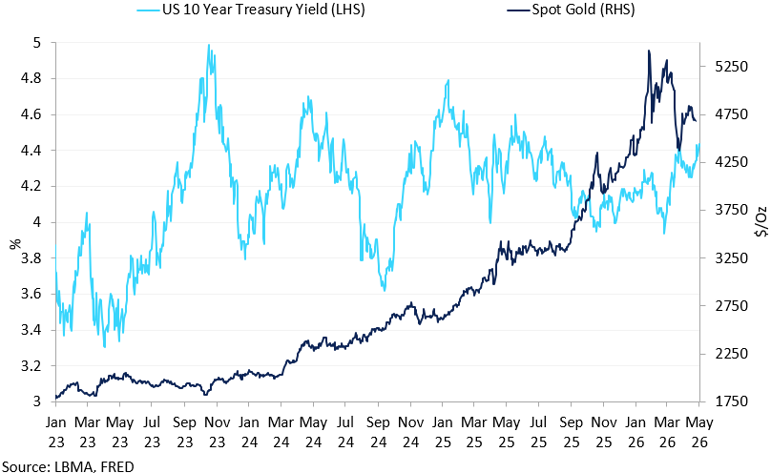
Structurally, however, the medium-term support remains intact. World Gold Council data show Q1 2026 total gold demand, including OTC, rose 2% YoY to 1,231t, while the value of demand reached a record $193bn due to elevated prices. Bar and coin demand remained particularly strong at 474t, up 42% YoY, while Indian investment demand surpassed jewellery demand for the first time on record, highlighting the increasing importance of investment flows within the broader demand mix. Central-bank and reserve-diversification demand also continue to provide a significant stabilising force, particularly as emerging-market institutions continue to reduce dependence on dollar reserves. Importantly, ETF holdings remain elevated despite recent price volatility. Total known ETF holdings peaked above 100Moz earlier this year and, although flows have moderated more recently, current holdings near 98.7Moz suggest that institutional participation remains supportive.
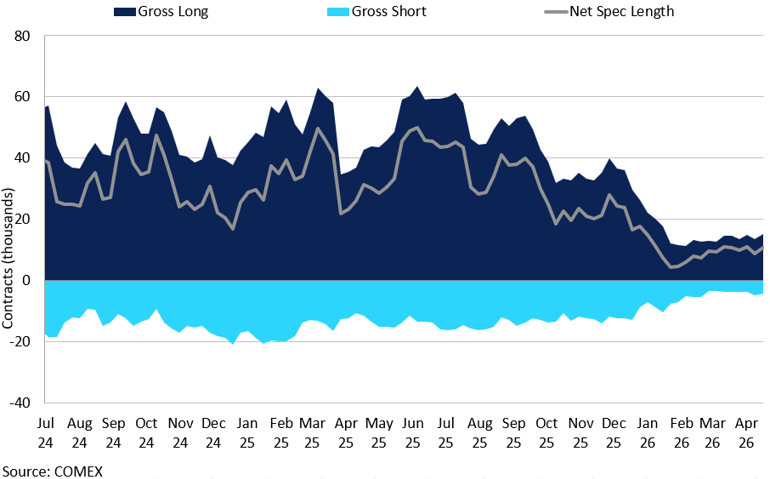
The near-term issue is that structural demand is currently acting more as a floor than a fresh upside catalyst. COMEX positioning data show managed-money net length remains moderate, with positioning stabilising around 95–100k contracts in recent weeks after the sharp reduction seen earlier in the year. This suggests that speculative length is no longer excessively crowded, reducing liquidation risk, but also highlighting the absence of aggressive momentum buying. As a result, a stronger move higher likely requires a clearer macro shift, particularly lower real yields, a softer dollar or stronger confidence that inflation risks are giving way to weaker growth and eventual policy easing. Until that shift becomes clearer, gold is likely to remain highly reactive to inflation data and energy headlines, but continue struggling to establish a sustained breakout while yields remain elevated.
Q2 Outlook
We expect gold to remain structurally supported in Q2, although upside will likely be capped while oil-driven inflation concerns keep US yields and the dollar firm. We see support around $4,500/oz, underpinned by central-bank buying, reserve diversification and resilient Asian investment demand. While softer growth data or a shift towards Fed easing could lift prices back towards the $4,800/oz area, we expect gold to remain primarily driven by rates and dollar expectations, leaving the market rangebound rather than positioned for a sustained breakout higher.
Silver

Key Points
- We expect silver to remain supported in Q2 by persistent supply deficits and relatively light positioning.
- Upside is likely to stay gradual unless falling yields and stronger ETF inflows revive investment demand.
- Silver should remain more macro-sensitive than gold, with performance tied closely to growth.
Silver entered Q2 with a firmer fundamental profile than gold, although price direction remains more sensitive to flows and macro conditions. The market continues to be supported by a persistent supply deficit, with the Silver Institute projecting another shortfall in 2026 of around 46.3Moz following an estimated 40.3Moz deficit in 2025. This would extend the current multi-year deficit, driven by constrained mine supply growth, while demand from solar and electrification continues to provide underlying support despite softer manufacturing conditions. However, the demand picture is becoming more uneven at higher prices. Total silver demand declined by around 2.3% in 2025 to its lowest level since 2021, suggesting that elevated prices and weaker industrial conditions have already begun to weigh on parts of the consumption base. As a result, the deficit continues to underpin the market, but sustained upside still depends heavily on investor participation.
Comex COT Silver Investment Funds Positioning
Speculative silver positioning remains historically light.
That remains visible in both positioning and ETF flows. Following the sharp correction from January highs, COMEX silver positioning has fallen materially, with managed-money net length declining towards the 10–15k contract range, well below the peaks seen through much of 2024 and early 2025. This suggests speculative positioning is no longer crowded, reducing liquidation risk, but also highlighting the absence of strong momentum participation from funds. ETF holdings reinforce the same trend. Total known silver ETF holdings have declined steadily from highs near 0.87bn oz in late 2025 to around 0.79bn oz more recently, signalling softer institutional participation despite the persistent supply deficit. In practical terms, the market currently lacks the scale of investment inflows typically associated with a sustained directional rally. A stronger move higher would likely require renewed ETF buying, rebuilding speculative length and a more supportive macro environment.
The macro setup also remains more two-sided for silver than for gold. Silver tends to benefit disproportionately from lower yields, improving liquidity conditions and a softer dollar, but its industrial exposure makes it more sensitive to whether easing expectations are driven by softer inflation or deteriorating growth. If markets begin to price Fed easing because inflation moderates while growth remains resilient, silver should outperform gold, supported simultaneously by improving liquidity conditions and industrial demand expectations. However, if easing expectations emerge because growth deteriorates more aggressively, silver’s industrial exposure could become a headwind, leading to higher volatility and relative underperformance versus gold. In this sense, silver remains highly sensitive to whether macro conditions evolve into a “soft landing” or a more pronounced slowdown. This distinction is likely to remain one of the key drivers of relative performance across precious metals during Q2.
Q2 Outlook:
Silver should remain supported in Q2, underpinned by persistent supply deficits and relatively light speculative positioning. We see support emerging in the $70–72/oz range, with the structural deficit and lighter positioning helping to limit downside pressure. A move back towards the $80-85/oz range remains possible if macro conditions become more supportive and investment flows recover, although a sustained break above $85/oz would require a broader re-engagement from ETF and speculative demand. Overall, silver should continue to trade with higher macro sensitivity than gold, leaving it well supported structurally but still dependent on improving investment flows for a sustained breakout.
PGMs

Key Points
- Platinum is entering Q2 with tightening physical balances and improving investor participation, reinforcing its structural support.
- Palladium remains more exposed to cyclical automotive demand and weaker long term visibility despite some recovery in positioning.
- As a result, platinum is increasingly structurally driven, while palladium remains range bound and sentiment led.
Platinum and palladium enter Q2 on increasingly different paths. Platinum is benefiting from tightening physical conditions and improving investor interest, while palladium remains more exposed to uncertainty surrounding automotive demand and electrification trends. The World Platinum Investment Council (WPIC) forecasts a fourth consecutive annual platinum deficit in 2026, currently estimated at around 240koz following a substantially deeper 1.08Moz shortfall in 2025. As a result, cumulative deficits since 2023 are expected to approach 3Moz by the end of this year, further eroding already depleted above-ground inventories. At the same time, supply growth remains structurally constrained, particularly in South Africa, where ageing shafts, rising operating costs, labour pressures and years of underinvestment continue to limit mine output. Palladium, by contrast, faces a less convincing demand outlook. Although the market is no longer facing the same acute surplus concerns seen during the initial EV transition narrative, demand visibility remains weaker due to palladium’s heavier reliance on petrol autocatalyst demand.
Palladium to Platinum Ratio
The sustained decline in the palladium to platinum ratio reflects platinum’s tightening fundamentals and weaker relative demand for palladium.
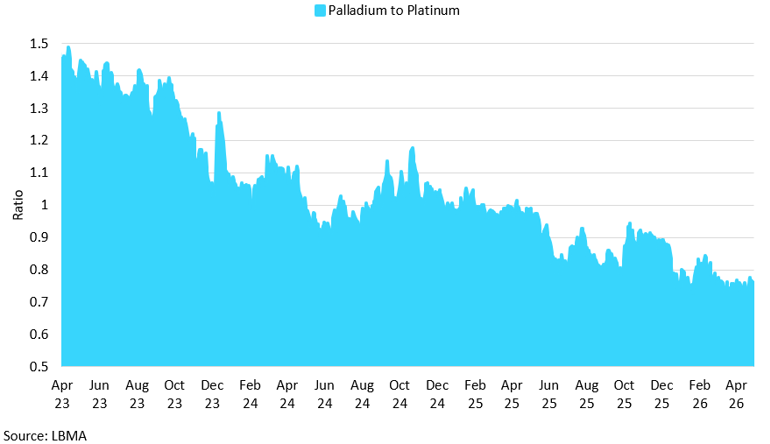
Automotive demand remains the key driver for both metals. Hybrid vehicle growth remains supportive for PGMs through higher catalyst loadings, partly offsetting weaker pure ICE demand. Platinum is also benefiting from continued substitution away from palladium in autocatalysts, although some limited reverse substitution has emerged as palladium’s discount widened again through late 2025 and early 2026. Beyond automotive demand, platinum continues to receive support from chemical, glass and hydrogen-related applications. Investor participation is also becoming increasingly important for price direction. Platinum ETF holdings remain elevated near 3Moz, with positioning recovering into positive territory through Q1. Palladium positioning has also improved from the deeply bearish levels seen in 2024, although ETF holdings continue to trend lower, pointing to weaker investor conviction than in platinum.
The key difference between the two markets is that platinum’s tightening physical balance is now being reinforced by improving investor participation, while palladium remains largely dependent on cyclical automotive sentiment. Persistent platinum deficits and declining inventory coverage have materially improved the market’s medium-term pricing power, reducing downside risk compared with previous years. Palladium positioning has recovered from the extremely bearish conditions seen in 2024, but investor conviction remains weaker given the absence of a strong long-term demand growth narrative. As a result, platinum is increasingly behaving like a tightening precious-industrial hybrid, whereas palladium remains more cyclical and sentiment-driven.
Q2 Outlook:
Platinum should remain the stronger-performing PGM through Q2, supported by persistent physical deficits, structurally constrained mine supply and still-elevated investment holdings. We expect platinum to remain well supported above the $2,000/oz level, with historically tight inventory coverage continuing to support pull-backs. Palladium, meanwhile, should remain more range-bound and sentiment-driven. While downside pressure has eased, sustained upside is likely to remain capped by weaker long-term demand visibility and uncertainty surrounding automotive substitution trends. Overall, we continue to favour platinum over palladium on both structural and investment grounds, with platinum increasingly supported by genuine physical tightness rather than purely speculative momentum.

