EUR / USD
Source: Massive (polygon.io)
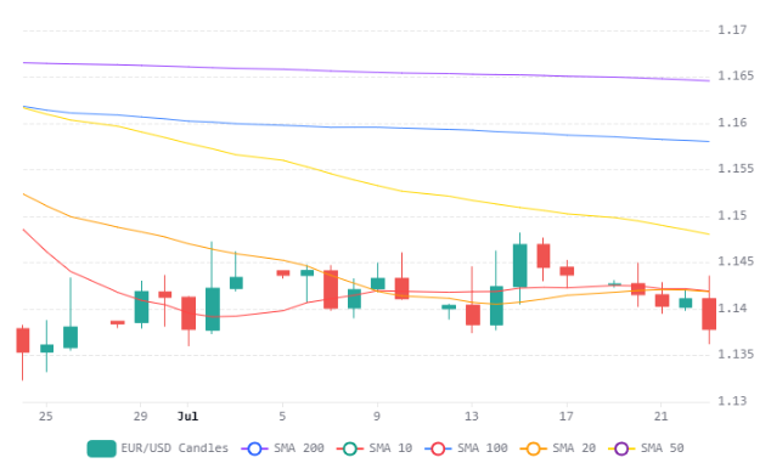
The EUR/USD pair declined approximately 0.26% on Thursday, July 23, 2026, sliding from 1.1405 to 1.1376 amid broad dollar strength driven by surging oil prices and exceptionally strong US labour market data. The catalyst was Brent crude breaching $100 per barrel following Houthi attacks on Saudi oil tankers, a development that disproportionately damages the eurozone economy given its far greater exposure to energy price shocks compared to the United States. On the US side, initial jobless claims plunged to 187,000—the lowest since 1969—dramatically shifting Fed rate hike expectations, with markets now pricing a 36% chance of an increase at next week's FOMC meeting versus just 12% a week ago.
Despite the ECB holding rates at 2.25% and President Lagarde opening the door to a September hike, the euro weakened as the interest rate differential narrative moved firmly in favour of the dollar given superior US economic resilience. Technically, the pair remains entrenched below all major moving averages—the 200-day SMA at 1.1635, the 50-day at 1.15, and the 20-day at 1.1416—while the daily RSI near 39 confirms persistent bearish momentum within the multi-month downtrend from January's highs above 1.20.
Looking ahead, the 1.1330 support zone represents the critical inflection point: a hold could trigger a mean-reversion bounce toward the 1.1400 level, while a decisive break lower would expose 1.1280–1.1300. With geopolitical escalation showing no signs of abating and the fundamental backdrop of energy vulnerability continuing to undermine European growth prospects, the path of least resistance for EUR/USD remains to the downside in the near term.
USD / JPY
Source: Massive (polygon.io)
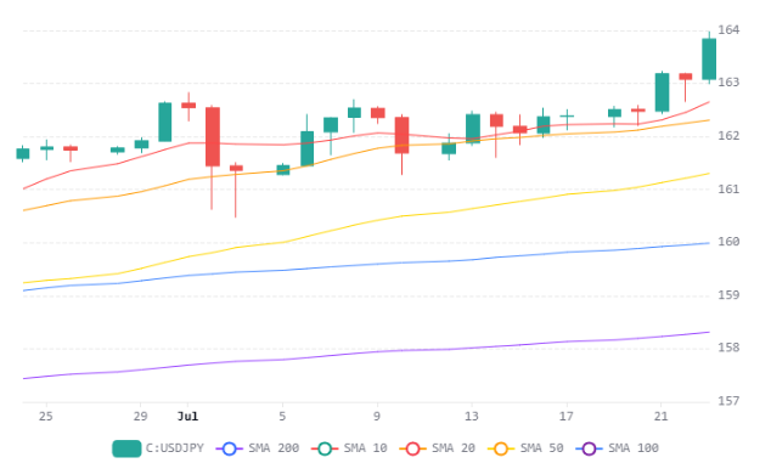
The USD/JPY pair has surged to its highest level since 1986, trading near 163.86-163.98 as powerful macroeconomic forces continue to drive yen weakness. The primary catalyst remains the wide interest rate differential, with markets pricing an 81-83% probability of a Fed rate hike in September while the Bank of Japan is expected to hold rates steady at its July 31 meeting despite having raised to a 31-year high of 1%. Escalating Middle East conflict has compounded yen vulnerability, as Brent crude above $100 per barrel disproportionately damages Japan's energy-import-dependent economy while the US remains relatively insulated from the shock.
From a technical perspective, the pair trades well above all key dynamic support levels—the 20-day SMA at 162.42, the 50-day SMA at 161.07, and the 200-day SMA at 157.73—though the daily RSI at 72.35 signals overbought conditions that could invite mean-reversion selling. A decisive break above the 164 psychological barrier could fuel momentum-driven extension toward 164.50–165.00, while failure to hold above that level risks profit-taking back toward the 162.30 area.
Japanese authorities have spent approximately $72 billion on intervention during April and May without preventing further deterioration, and while officials signal openness to accelerated tightening, traders remain unconvinced that a rate increase before October is realistic. The structural backdrop—combining Prime Minister Takaichi's expansionary fiscal stance, eroding fiscal credibility, and Japan's energy vulnerability—suggests that absent a genuine policy shock from the BOJ, the path of least resistance for USD/JPY remains higher in the near term despite stretched positioning
GBP / USD
Source: Massive (polygon.io)
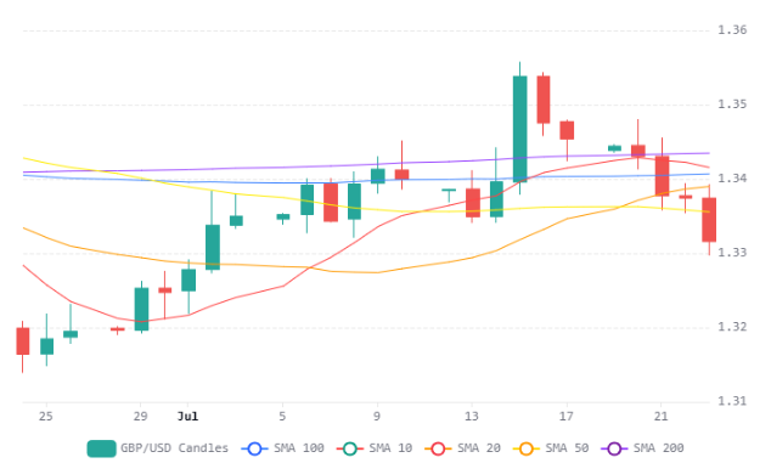
The GBP/USD pair is under significant selling pressure, declining approximately 0.43% over the past 24 hours to stabilize around 1.3318, now trading decisively below the 200-day, 50-day, and 20-day SMAs clustered near 1.34. The intensification of US-Iran conflict and surging oil prices above $100 per barrel are driving broad safe-haven flows into the dollar, while simultaneously threatening the UK's energy-dependent economy with a renewed inflation shock that could push CPI above 3% in coming months.
The interest rate differential is shifting firmly in the dollar's favour, with US 10-year Treasury yields surging to 4.7% and markets now pricing over 80% probability of a September Fed hike, while the Bank of England is expected to hold rates steady. Unexpectedly strong US jobless claims data at 187,000 reinforces the narrative of American economic resilience relative to the UK, which faces greater structural vulnerability to energy price shocks.
From a technical perspective, the daily RSI at 44 reflects growing bearish momentum, with the critical support level at 1.3300 now being tested. A sustained break below this level would open the path toward 1.3147, while any recovery would need to reclaim the 1.3300 level before challenging the moving average cluster at 1.34—a scenario that appears unlikely given the current macro headwinds facing sterling.
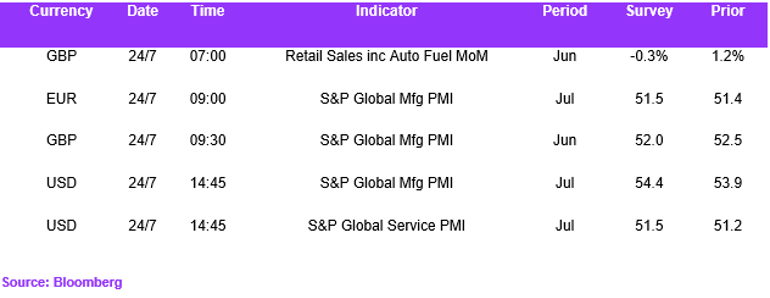
Economic Calendar