EUR / USD
Source: Massive (polygon.io)
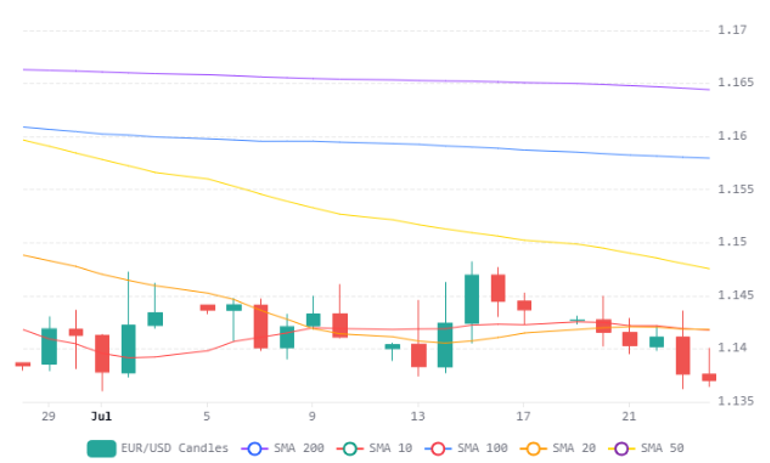
The EUR/USD pair continued to trade under significant downside pressure last week, trading near 1.1370 by the end of the week, having retreated from monthly highs around 1.1480. The pair sits well below all major moving averages—including the 20-day SMA at 1.1416—while an RSI reading of 38.5 confirms persistent bearish momentum, with price compression near the one-year low of 1.1329 suggesting the market is coiling for a directional breakout.
The dollar's resurgence, driven by safe-haven demand from escalating US-Iran tensions, oil prices briefly exceeding $100 per barrel, and rising Treasury yields at multi-year highs, has been the primary catalyst weighing on the pair. The Federal Reserve's July 28-29 meeting represents the most critical near-term event risk, with market-implied odds of a rate hike surging to 30-36% amid unusually hawkish rhetoric from FOMC members. With Chair Warsh expected to provide little forward guidance, the dot plot is likely to carry more weight than the press conference or subsequent minutes in shaping market expectations and the next leg for EUR/USD.
A dovish hold from the Fed could push yields and the dollar lower, potentially allowing EUR/USD to reclaim the 1.14 area and trigger a short-covering rally toward 1.15, while a hawkish surprise or confirmed September hike signal would likely drive a bearish breakdown below 1.1330 into fresh yearly lows. The week's dense data calendar—including US Q2 GDP, core PCE, and eurozone flash inflation—adds further volatility risk around an already pivotal juncture. The divergence between near-term dollar strength and medium-term consensus forecasts of 1.16-1.17 by year-end suggests that while the broader euro recovery thesis remains intact, the pair faces considerable headwinds through the summer months as rate differentials and geopolitical risk premia dominate price action.
USD / JPY
Source: Massive (polygon.io)
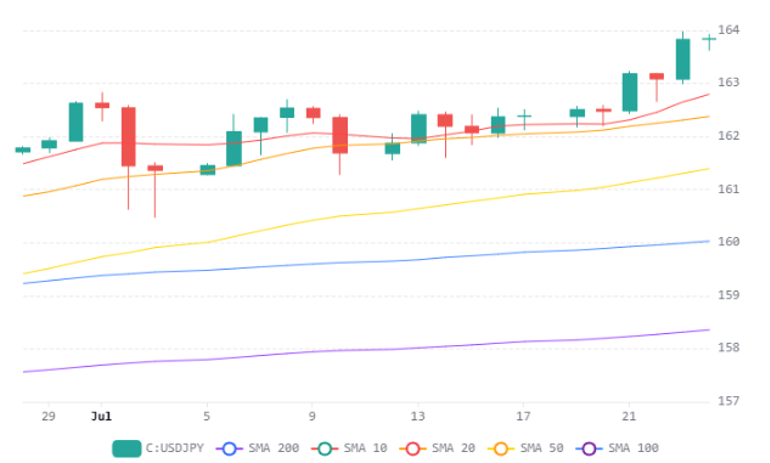
The USD/JPY pair is consolidating at historically elevated levels near 163.90, just below the all-time high of approximately 163.99 set on July 23rd, with the yen at its weakest level against the dollar in four decades. The persistent 275 basis point interest rate differential between the Fed funds rate at 3.50-3.75% and the Bank of Japan's policy rate at 1.0% remains the dominant structural driver of yen weakness, compounded by surging oil prices above $100 per barrel that worsen Japan's trade balance as a major energy importer.
The technical picture shows the pair trading within an exceptionally narrow 0.19% range over the past three days, with the daily RSI near 72 approaching overbought territory while price remains well extended above key support levels including the 20-day SMA at 162.243. The coming week's Fed and BOJ rate decisions represent the primary catalyst risk, with both central banks expected to hold rates unchanged, though rising odds of a Fed hike later in the summer contrast with the BOJ's more cautious timeline for its next move to 1.25%.
Prime Minister Takaichi's unfunded $2.3 trillion industrial investment plan has further undermined yen confidence, drawing comparisons to the UK's Truss fiscal episode and amplifying concerns about Japan's fiscal sustainability with debt-to-GDP near 230%. A breakout above the 164 handle to fresh all-time highs remains the base case if yield differentials widen further, while the bearish scenario involves an overbought reversal targeting the 162.28–162.38 support cluster where the 20-day SMA sits. The confluence of safe-haven dollar demand, elevated US Treasury yields at 4.68%, and Japan's structural vulnerabilities to energy-driven inflation creates an environment that continues to favour dollar strength, though the stretched positioning warrants caution on new longs at current levels.
GBP / USD
Source: Massive (polygon.io)
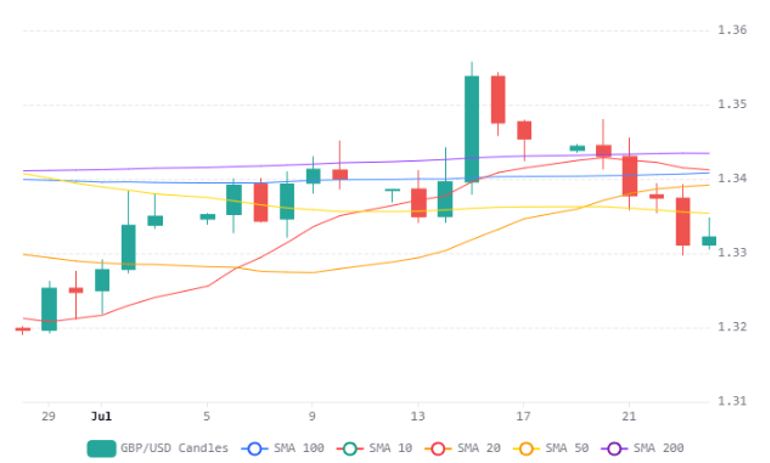
GBP/USD remains technically compressed, trading near 1.3322 and pinned below a dense cluster of resistance at the 200-day, 50-day, and 20-day SMAs around 1.34, with the daily RSI at approximately 45 confirming muted bearish momentum. The 1.3300 level is acting as nearby support, and positively skewed intraday volume distribution suggests underlying demand near that handle, though a decisive break lower could expose the late-June swing low near 1.3147.
Fundamentally, the macro divergence between the Fed and BoE is tilting against sterling heading into next week's critical central bank decisions. The Fed is expected to deliver a hawkish hold at 3.50-3.75% with rising market-implied odds of tightening by September (approximately 79% cumulative probability), bolstered by surging oil prices, new tariffs reigniting inflation fears, and 30-year Treasury yields at their highest since 2007. In contrast, the BoE faces a stagflationary bind—UK GDP grew only 0.1% in May, constraining its ability to respond to an inflation rebound projected toward 3.25% later this year as energy costs feed through.
While CFTC data shows net speculative shorts on sterling narrowing from -71.3K to -55.6K contracts, the overall market remains positioned against the pound, and geopolitical energy risks disproportionately affecting import-dependent economies like the UK reinforce the bearish fundamental backdrop for GBP/USD in the near term.
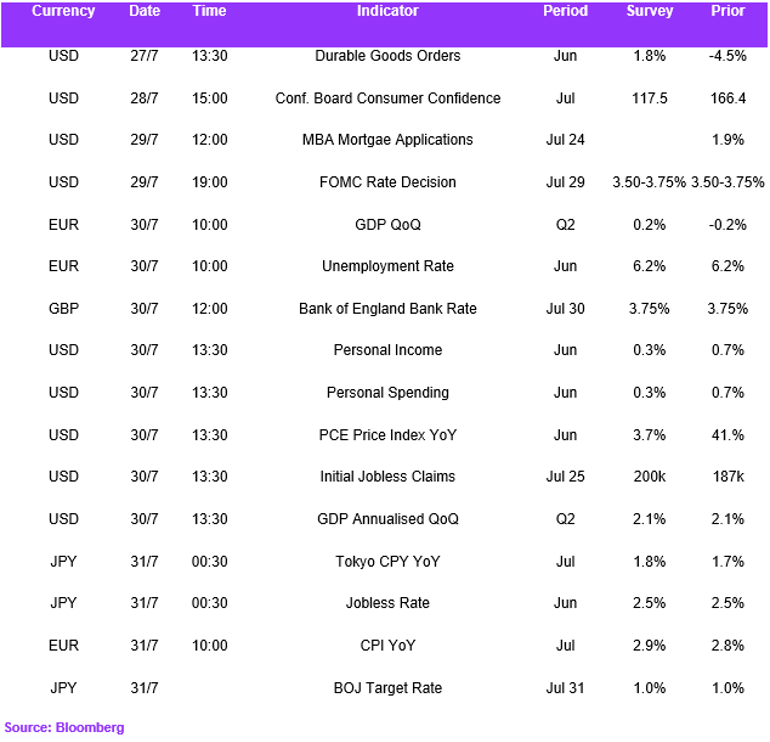
Weekly Economic Calendar