


EUR / USD
Source: Massive (polygon.io)
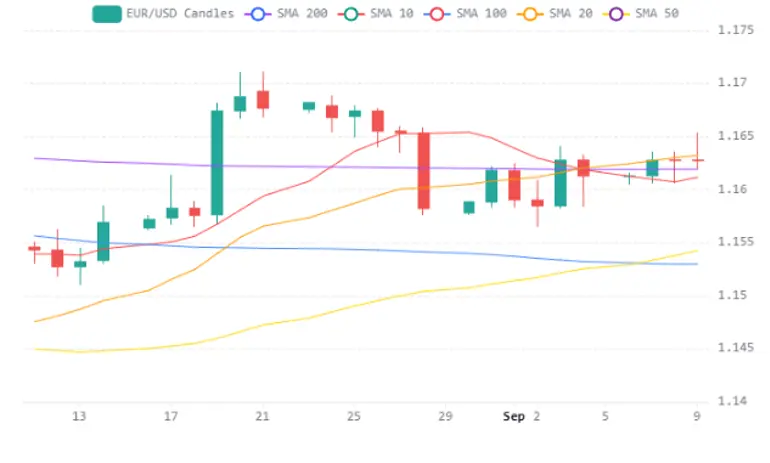
EUR/USD closed virtually unchanged at 1.1627 over the past 24 hours, reflecting a market caught between two central banks both leaning toward tighter monetary policy in response to an energy-driven inflation shock. The pair sits at a critical technical juncture, with price converging precisely at the 200-day and 20-day simple moving averages — all clustered around 1.16 — while the daily RSI at 56 signals mildly bullish but fading momentum.
The fundamental backdrop is defined by competing rate-hike cycles: the ECB is virtually certain to raise its benchmark rate from 2.40% to 2.65% on Thursday, driven by surging European energy costs, while Fed futures assign roughly 60% probability to a 25-basis-point hike at the September 15-16 meeting following a surprisingly strong August payrolls print of 162,000 jobs. Friday's U.S. CPI report is the pivotal near-term catalyst — a softer print would reduce Fed hike odds and likely propel EUR/USD back toward monthly resistance near 1.1707, while a hot reading would reinforce dollar strength and risk breaking the 1.16 moving-average confluence to the downside.
The oil shock introduces an asymmetric risk for the pair. Europe's heavy dependence on imported energy exposes the eurozone to a potential stagflationary squeeze, particularly with Brent crude above $100 and European natural gas at its highest since early 2023, which could undermine the euro even as the ECB tightens. Meanwhile, the U.S. 10-year Treasury yield at 4.85% and a failed $6 billion bond buyback have paradoxically supported the dollar intraday despite mounting structural concerns about U.S. fiscal sustainability. The pair remains range-bound between these crosscurrents, and a decisive directional move likely awaits the resolution of this week's inflation data and the clarity it provides on the relative trajectory of Fed versus ECB policy.
USD / JPY
Source: Massive (polygon.io)
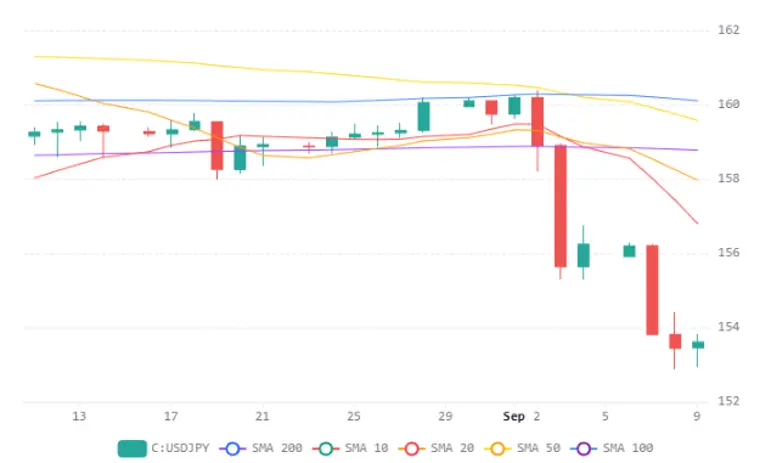
The USD/JPY pair is undergoing a dramatic reversal, having plunged approximately 6% from its late-July highs above 164 to trade near 153.60, driven by a fundamental repricing of interest rate expectations in both Japan and the United States. The Bank of Japan's anticipated 25-basis-point rate hike, supported by accelerating producer prices, rising real wages, and upward GDP revisions, is converging with persistent U.S. inflation pressures to narrow the rate differential that has long underpinned the pair. This compression has squeezed annualized carry trade returns from 5–6% in 2024 down to roughly 2.5–3.5%, undermining the $2.34 trillion in cross-border yen borrowing that previously anchored dollar-yen strength.
The unprecedented joint U.S.-Japan currency intervention in late July alongside Treasury Secretary Bessent's unusually aggressive rhetoric, signals a policy commitment to yen stabilization that traders should not dismiss lightly. Structural capital flows reinforce the bearish USD/JPY outlook, as Japanese institutional investors reassess overseas allocations amid multi-decade-high domestic bond yields, with even modest repatriation estimated at $55 billion capable of generating significant yen demand.
From a technical perspective, the pair is trading deeply below all major moving averages — the 200-day SMA at 159, the 50-day at 160, and the 20-day at 158 — while the daily RSI near 25 reflects profoundly oversold conditions that could spark a mean-reversion bounce toward the 158 area. However, unless the fundamental drivers reverse, any corrective rally is likely to be sold into, with a decisive break below the 153 support zone opening a path toward the January lows around 152, confirming a broader structural downtrend with substantial room to extend.
GBP / USD
Source: Massive (polygon.io)
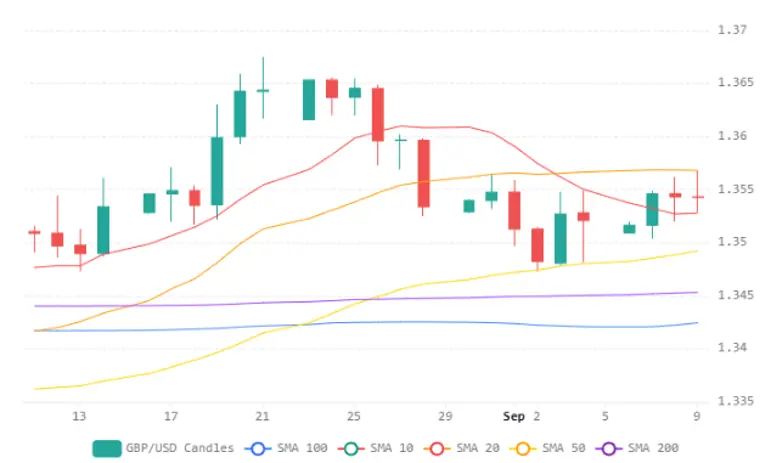
GBP/USD is consolidating near 1.3542 after a strong 1.3% rally over the prior month, with price action confined to a narrow 0.29% range and repeatedly failing to break through resistance at 1.3563, where three separate rejections during London and early New York sessions signal fading bullish momentum. The convergence of the 50-day SMA and 200-day SMA near the 1.3500 handle creates a dense support cluster just beneath spot, making this level the critical line in the sand for near-term direction.
The macro backdrop is dominated by the US-Iran conflict pushing Brent crude above $100, reigniting inflation fears that could force the Bank of England's hand if UK inflation surges above 4%, even as the BoE is expected to hold rates at its September 17 meeting. On the dollar side, 10-year Treasury yields have climbed to 4.85% and futures markets price a 60% probability of a Fed rate hike in September, though the dollar index slipping below 99 — partly on yen strength — has provided some offset for sterling.
This week's US PPI and CPI releases will be decisive: hotter-than-expected prints would likely cement the Fed hike, driving the dollar higher and pushing GBP/USD below the 1.3500 moving average cluster toward support at 1.3422, while softer data could fuel a break above 1.3563 resistance and open a path toward the 20-day SMA at 1.3600 and the prior swing high near 1.3665. The deeper risk for sterling is that synchronized global tightening from the ECB, BoJ, and potentially the Fed erodes the UK's relative rate advantage, compounding stagflationary pressures from elevated energy costs and surging gilt yields that threaten to undermine the growth narrative supporting the pound.

