


EUR / USD
Source: Massive (polygon.io)
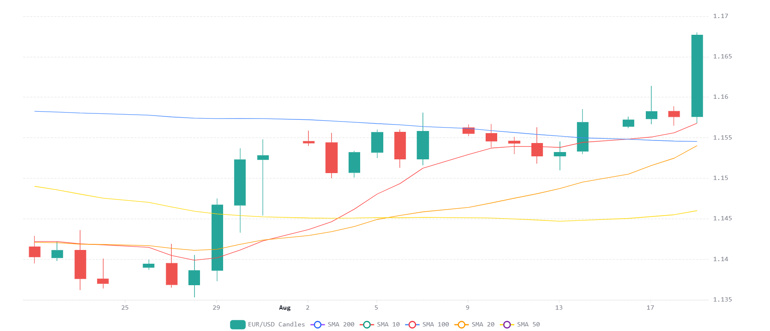
EUR/USD surged approximately 0.8% over the past 24 hours to around 1.1674, with strong buying during the European and US session crossover driving the pair decisively through the 200 day SMA near 1.1600. Price is now comfortably above the 20 day and 50 day SMAs and the 30 day VWAP clustered around 1.1500, marking a notable improvement in the broader technical structure. We see the break above the 200 day SMA as particularly significant, although the daily RSI has risen to 73, indicating that momentum is becoming overextended.
The strength of the move suggests buyers remain firmly in control, with the pair reaching its highest level in more than a month. Importantly, the former 200 day SMA resistance near 1.1600 should now provide the first meaningful test of support if profit taking emerges.
We see scope for EUR/USD to extend towards the 1.1700 to 1.1750 region if dollar weakness persists and price remains above the 200 day SMA. However, with RSI now in overbought territory, we expect the risk of a near term consolidation or corrective move to increase. A break back below 1.1600 would weaken the bullish signal and could expose the 20 day SMA around 1.1500 if selling pressure accelerates.
USD / JPY
Source: Massive (polygon.io)
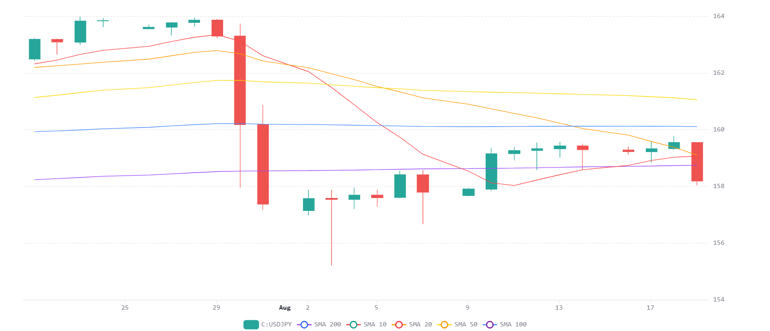
USD/JPY declined approximately 0.85% to around 158.22, with selling accelerating during the European and early US sessions as the pair broke decisively below 159. Price is now beneath the 20 day SMA near 159 and remains well below the 50 day SMA around 161 and the 30 day VWAP near 160. More importantly, the pair has slipped below the 200 day SMA around 159, turning this longer term trend indicator from support into resistance and reinforcing the deterioration in the technical structure.
The daily RSI has fallen to around 37, reflecting strengthening bearish momentum without yet reaching oversold territory. We therefore see room for additional downside before technical conditions become sufficiently stretched to encourage a more meaningful recovery.
A sustained move below 158 would strengthen the bearish structure and could expose the early August support region around 156. Conversely, buyers would need to reclaim the 200 day SMA and subsequently the 159 to 160 area to reduce immediate downside pressure. We expect rallies to remain vulnerable while price stays below this resistance cluster, although the approaching 156 support area could encourage short covering if selling becomes extended.
GBP / USD
Source: Massive (polygon.io)
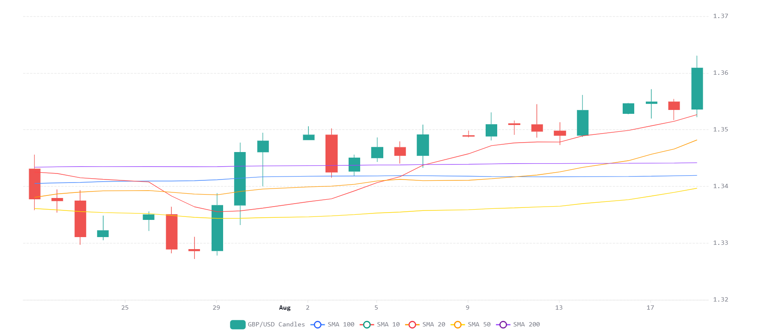
GBP/USD rallied approximately 0.5% to around 1.3606, having briefly reached 1.3629 as strong buying during the early US session pushed the pair further above its major moving averages. Price remains comfortably above the 200 day and 50 day SMAs near 1.3400, the 20 day SMA around 1.3500 and the 30 day VWAP near 1.3400, maintaining a clearly constructive technical structure.
The daily RSI has climbed to around 68, reflecting significantly stronger momentum than seen over the previous month. While this confirms persistent buying pressure, it also leaves the pair approaching overbought conditions and increases the likelihood of some consolidation following the recent advance.
We see a sustained break above 1.3629 opening the way towards the three month high around 1.3650, with the broader trend remaining supportive while price holds above 1.3600. However, failure to sustain the breakout could encourage profit taking. In that scenario, we expect the 20 day SMA around 1.3500 to provide the more significant downside support should the current momentum begin to fade.


