


EUR / USD
Source: Massive (polygon.io)
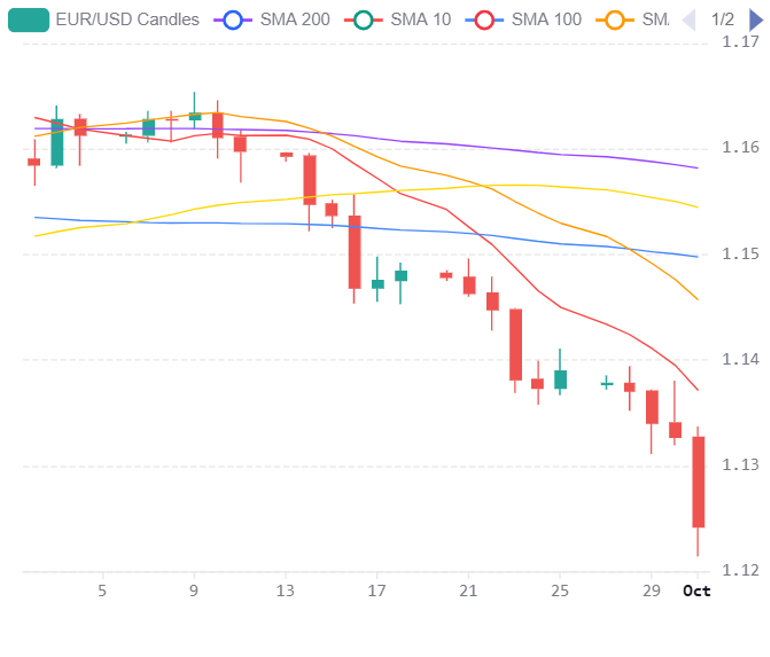
EUR/USD has fallen to a fresh one year low around 1.1217, losing roughly 0.8% in a single session as the sharp rise in US Treasury yields widens the transatlantic rate differential. The US 10 year yield briefly reached its highest level since 2002, while resilient economic data, including jobless claims falling to 197,000 and continued expansion in manufacturing activity, have reinforced the relative strength of the US economy. Although softer PCE inflation has reduced the probability of an October Fed increase to around 37%, markets continue to price further tightening over the coming year, providing underlying support for the dollar.
The European backdrop remains considerably more challenging. Brent crude around USD 100 per barrel is adding to inflationary pressure while threatening growth across the energy dependent eurozone. Political and fiscal uncertainty in France and Germany is creating an additional headwind, while elevated European sovereign yields have done little to support the currency. We see these pressures limiting the euro’s ability to benefit from ECB tightening while the relative US growth and yield advantage remains substantial.
Technically, EUR/USD is trading well below the 20 day, 50 day and 200 day SMAs, as well as the 30 day VWAP, leaving a significant concentration of resistance between 1.1500 and 1.1600. The daily RSI around 16 signals extremely oversold conditions and increases the possibility of a corrective recovery towards 1.1280 to 1.1300. We expect 1.1217 to provide the immediate test on the downside, with a sustained break potentially exposing 1.1150 to 1.1100. Friday’s US nonfarm payrolls report will be the key catalyst, with a weaker employment reading offering the clearest route towards some near term stabilisation.
USD / JPY
Source: Massive (polygon.io)
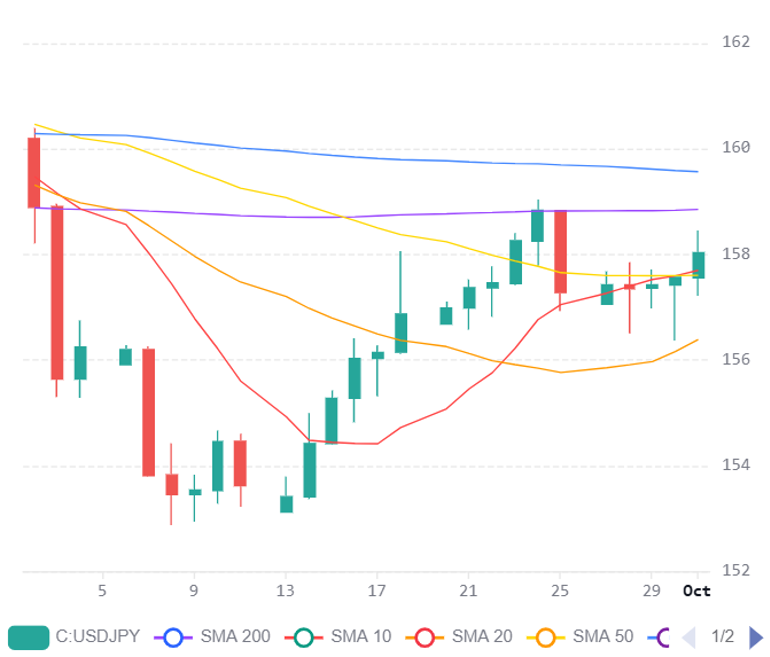
USD/JPY is trading around 158.07 as widening US Japan yield differentials continue to support the pair, although significant technical resistance and intervention concerns are limiting further gains. The US 10 year Treasury yield around 5.34% remains considerably above the Japanese 10 year yield near 3.1%, maintaining a substantial dollar advantage despite the BoJ raising its policy rate to 1.25%. Expectations of another BoJ increase in December should provide some support for the yen, but have so far been insufficient to offset the impact of rising US yields.
Technically, USD/JPY has moved above the 20 day SMA around 156.39 and the 50 day SMA near 157.61, strengthening the near term structure. However, the 200 day SMA around 158.84 represents the next major hurdle, followed by resistance near 160.36. The daily RSI around 57 confirms improving momentum without indicating overbought conditions. We see the ability to break and hold above 159 as increasingly important for determining whether the current recovery can extend towards 160.36.
Conversely, another rejection around the 200 day SMA could return attention to the 50 day SMA near 157.61, followed by the 30 day VWAP around 156.68. Intervention warnings from Japanese authorities and the possibility of a reversal in yen funded carry trades remain important risks to further upside. We expect volatility to remain elevated around these technical boundaries, particularly as Friday’s US payrolls report could materially alter expectations for the US Japan rate differential.
GBP / USD
Source: Massive (polygon.io)
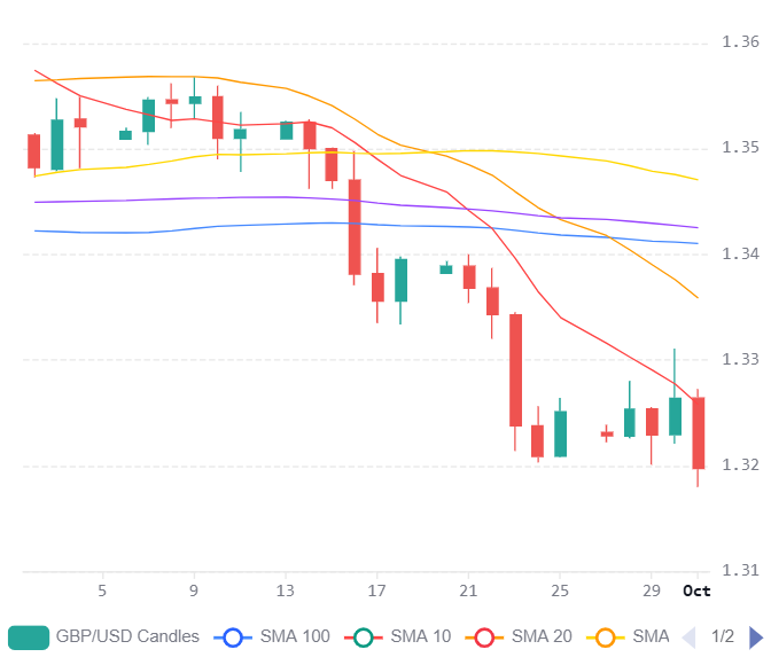
GBP/USD has extended its decline to around 1.3195, losing approximately 0.5% over the past 24 hours as rising global yields, elevated energy prices and broad dollar strength continue to weigh on sterling. UK 30 year gilt yields have climbed above 6%, increasing concerns over fiscal pressures and the economic consequences of higher borrowing costs. At the same time, the UK’s exposure to elevated energy prices presents an additional challenge by sustaining inflation while weakening the broader growth outlook.
Technically, GBP/USD remains below all its major moving averages, including the 200 day SMA around 1.3400 and the 50 day SMA near 1.3500. The daily RSI around 31 indicates that the decline is becoming increasingly stretched following a fall of more than 3% from the late August highs. We see scope for oversold conditions to generate a corrective recovery if 1.3180 holds, although the moving average cluster around 1.3400 remains a significant barrier to any sustained improvement.
We expect 1.3180 to provide the immediate directional test, with a decisive break exposing the June low around 1.3147 and potentially the yearly low near 1.3014. Conversely, softer US data could encourage some unwinding of recent Fed expectations and provide sterling with temporary relief. Friday’s nonfarm payrolls report therefore remains the key near term catalyst, particularly after softer PCE inflation reduced the probability of an October Fed increase to around 37%.


