EUR / USD
Source: Massive (polygon.io)
EUR/USD is entering a decisive week shaped by contrasting central bank trajectories, with the ECB virtually certain to deliver a 25-basis-point hike on Thursday — raising its key rate to 2.5% — while the Fed faces a finely balanced debate ahead of its mid-September meeting, where fed funds futures price only a 57% probability of a rate hike despite a strong 162,000 jobs gain in August. This hawkish ECB posture, reinforced by eurozone inflation accelerating to 3.3% and major banks now forecasting a further December hike, provides a fundamental tailwind for the euro against a dollar whose policy path hinges on the upcoming August CPI report. A cooling core CPI print near the expected 2.4% would strengthen the case for a Fed hold, potentially undermining dollar support, while a hotter-than-expected reading could push the 10-year Treasury yield through the 5% threshold and draw capital into US assets.
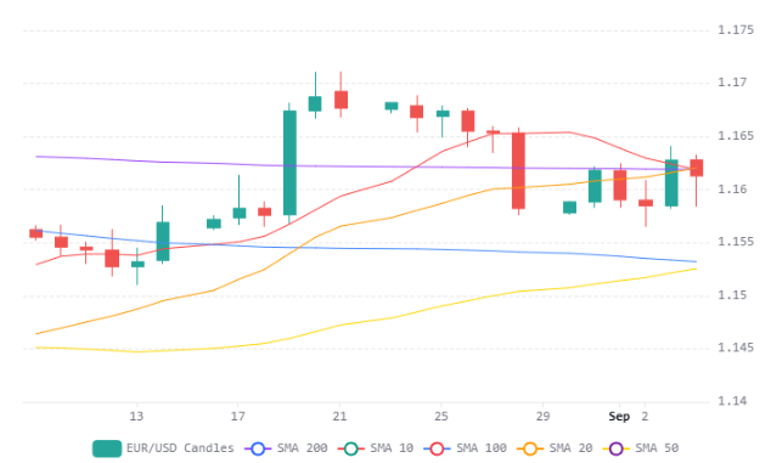
From a technical standpoint, the pair closed the week near 1.1613 after defending a dense support cluster where the 200-day SMA, and 20-day SMA all converge around 1.1600 — a level that held during Friday's sharp intraday selloff to 1.1587. The daily RSI has cooled to approximately 54, reflecting fading upward momentum, and the negative price skew from that midday spike lower hints at possible distribution by larger participants. Surging energy costs from the US-Iran conflict add a complicating layer, as the eurozone's greater dependence on energy imports makes it disproportionately vulnerable to fuel-cost pass-through even as ECB hawkishness persists.
The pair's ability to hold the 1.1587–1.1600 support zone heading into Thursday's ECB decision and Friday's US CPI release will likely determine near-term direction, with a sustained break higher targeting the 1.1700 August high resistance. Conversely, a breakdown below the clustered moving-average support would expose the 1.1500 area aligned with the 50-day SMA, particularly if Friday's inflation data reignites expectations for aggressive Fed tightening.
USD / JPY
Source: Massive (polygon.io)
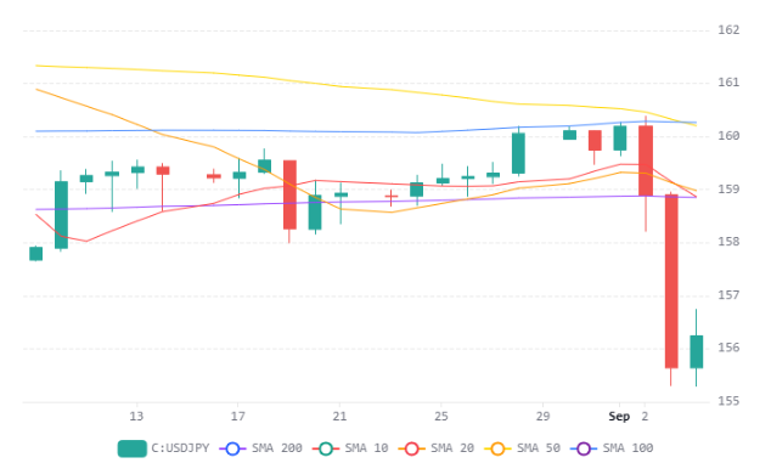
The USD/JPY pair is under significant bearish pressure, driven by a fundamental divergence between the Bank of Japan's accelerating tightening cycle and lingering uncertainty around the Federal Reserve's next move. Market expectations for a BOJ rate hike at the September 17-18 meeting have surged to approximately 97%, pushing Japanese two-year government bond yields to their highest levels since 1995, while the Fed's path remains data-dependent ahead of critical CPI and PPI releases. Structural yen demand is intensifying as Japan's $1.8 trillion Government Pension Investment Fund reportedly considers redirecting capital toward domestic assets, and Japanese investors have been selling foreign bonds at the fastest pace in four years — dynamics that add sustained downward pressure on the pair.
From a technical standpoint, the pair's decline of roughly 4.5% from late July highs near 164 has left it trading around 156.25, well below all key moving averages — the 200-day SMA at 158.86, the 20-day SMA near 159, and the 50-day SMA around 160.20 — which now form layered overhead resistance. The daily RSI at approximately 32 reflects deeply oversold conditions that could catalyse a short-covering bounce toward the 158.67–159 zone, yet the estimated $102–109 billion in accumulated short yen positions represents a powerful source of forced buying that could overwhelm any dollar recovery attempts. The heavy two-way positioning observed during the September 4th sell-off to 155.31 and subsequent rebound underscores that the 155.30 level is a critical support zone, and a decisive break below it would likely accelerate losses toward 154. On balance, the fundamental backdrop — narrowing rate differentials, capital repatriation flows, and a crowded yen-short positioning overhang — tilts the risk profile decisively toward further USD/JPY downside in the near term.
GBP / USD
Source: Massive (polygon.io)
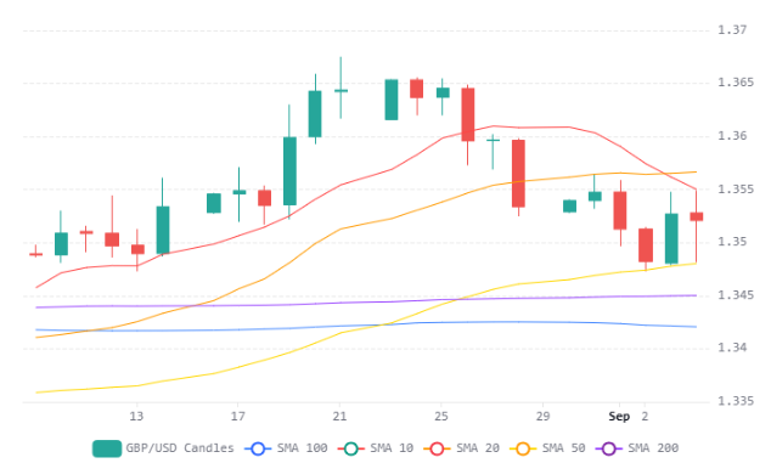
GBP/USD is trading in a technically neutral but slightly bearish posture, hovering near 1.3521 just below the 50-day SMA at 1.3500, with the 20-day SMA at 1.3600 acting as overhead resistance and the 200-day SMA at 1.3400 providing a key support floor. The daily RSI near 49 confirms the pair's indecision, while resistance clusters at 1.3560 and 1.3660 cap upside attempts and downside support at 1.3420 marks the line between consolidation and a deeper selloff toward 1.3280.
The fundamental backdrop is dominated by diverging monetary policy expectations, with the surprisingly strong U.S. August payrolls print of 162,000 jobs pushing fed funds futures to a 57% implied probability of a September rate hike, lending the dollar a clear yield advantage over sterling. Friday's U.S. CPI release—expected at 0.4% monthly headline with core easing to 2.4% year-over-year—will be the decisive catalyst, as a hotter print would likely cement Fed tightening and drive the pair lower, while a softer reading could rapidly unwind hawkish bets and offer sterling relief.
On the UK side, resilient PMI data showing services expansion at its best pace since April and five consecutive months of manufacturing growth provide a floor for the pound, but surging gilt yields at 19-year highs and mortgage rates approaching 7% threaten to erode consumer spending and complicate the Bank of England's outlook. Elevated energy costs, with Brent crude near $95–96 per barrel, add a persistent inflationary complication for both central banks, ensuring that GBP/USD volatility will remain elevated around Thursday's PPI and Friday's CPI releases as markets seek clarity on the rate divergence trajectory.
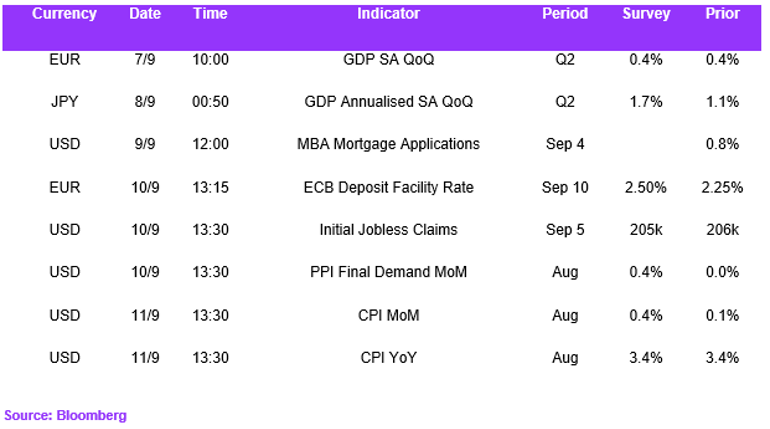
Economic Calendar