


EUR / USD
Source: Massive (polygon.io)
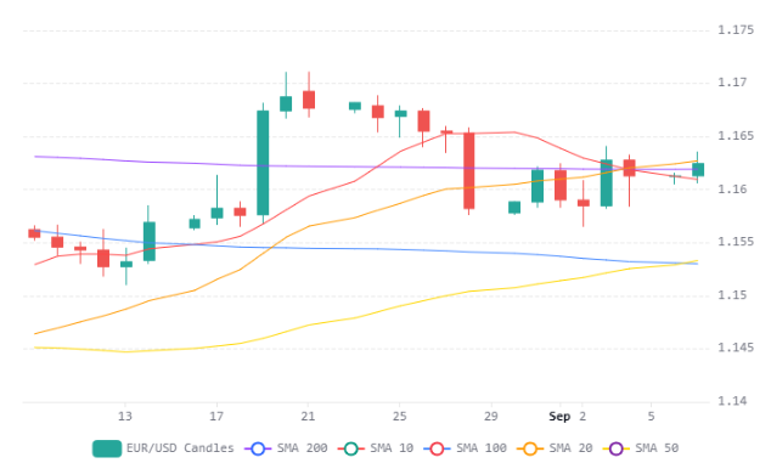
EUR/USD is trading in an exceptionally tight range near 1.1623, sitting almost exactly at the convergence of its 200-day SMA, and 20-day SMA around 1.16—a technical equilibrium that signals the market is coiling ahead of a breakout driven by this week's critical macro events. The daily RSI at 55 reflects neutral-to-mildly-bullish momentum, having cooled from readings above 60 in August, while the pair holds comfortably above the 50-day SMA at 1.15, preserving the broader uptrend structure.
The fundamental backdrop is defined by a stark asymmetry between the two central banks. The ECB's expected 25 basis-point hike to 2.50% on Thursday is fully discounted by markets—all 65 economists surveyed anticipate the move—meaning the euro has limited upside from the decision itself, and attention will shift entirely to whether President Lagarde signals this as the terminal rate. On the U.S. side, the picture is far more open-ended: August payrolls surprised sharply to the upside at 162,000 versus expectations near 53,000, pushing the probability of a September Fed hike to 57–65%, with Thursday's PPI and Friday's CPI data capable of swinging that probability toward 80–90% on a hot print.
This data dependency gives the dollar a potential impulse advantage the euro lacks, yet several factors temper the bearish euro case. Eurozone Q2 GDP was revised upward to 0.6% quarter-on-quarter, investor sentiment reached its strongest since early 2022, and the dollar index remains soft near 99 as net long positioning has declined sharply. A decisive break above the 1.1635–1.1707 resistance zone would confirm bullish continuation, while a failure to hold the clustered support at 1.16 opens the door to a retest of 1.1522 and potentially deeper losses toward 1.1330 should U.S. inflation data catalyse renewed dollar strength.
USD / JPY
Source: Massive (polygon.io)
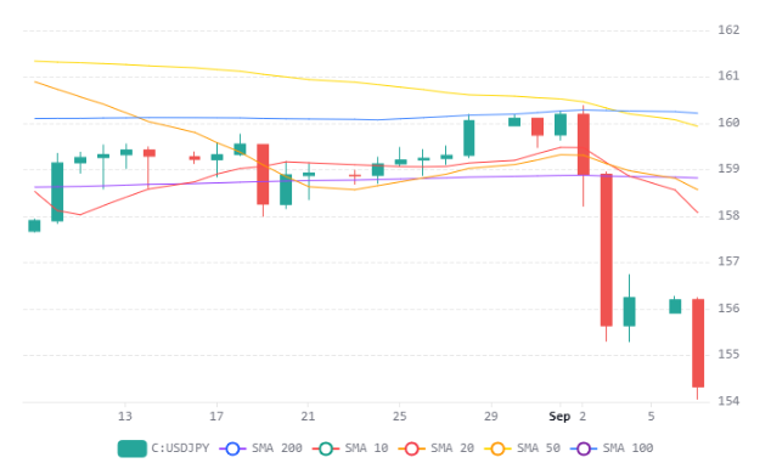
The USD/JPY pair is undergoing a significant regime shift, with the yen surging to around 154 as a confluence of fundamental and technical forces align against the dollar. The primary catalyst is a dramatic repricing of Bank of Japan monetary policy expectations, with markets now assigning near-certainty to a rate hike at the September 18 meeting that would bring the policy rate to 1.25 percent, while Japanese 10-year government bond yields have climbed to approximately 2.93 percent—levels not seen since 1996—compressing the US-Japan rate spread from roughly 250 basis points a year ago to around 186 basis points. This narrowing differential is undermining the structural rationale for the massive short-yen carry trade, where an estimated $103–$109 billion in bearish yen positions remain outstanding and vulnerable to further unwinding.
The technical picture reinforces the bearish momentum, with the pair shedding over 5.7 percent in the past month and now trading well beneath all key moving averages—the 200-day SMA near 159, the 50-day SMA around 160—while the daily RSI has plunged to approximately 26, deep into oversold territory. Tokyo's deployment of roughly $97–$100 billion in yen-buying intervention, coordinated partly with Washington in the first joint currency operation since 2011, adds a critical policy dimension, particularly as US Treasury Secretary Bessent has publicly encouraged decisive Japanese monetary tightening to address yen weakness.
Looking ahead, the upcoming US CPI release on September 11 looms as the decisive near-term catalyst: a hot reading could seal a Fed hike and trigger a mean-reversion bounce toward the 158.6 moving average cluster, while a softer print would leave the dollar vulnerable and open the door toward the January lows near 152.2. The broader confluence of BOJ tightening, carry trade unwinding, Japanese capital repatriation into higher-yielding domestic bonds, and coordinated US-Japan diplomatic pressure represents a potentially durable shift in the pair's trajectory, though the deeply oversold technical readings caution that sharp countertrend rallies remain a risk within the prevailing downtrend.
GBP / USD
Source: Massive (polygon.io)
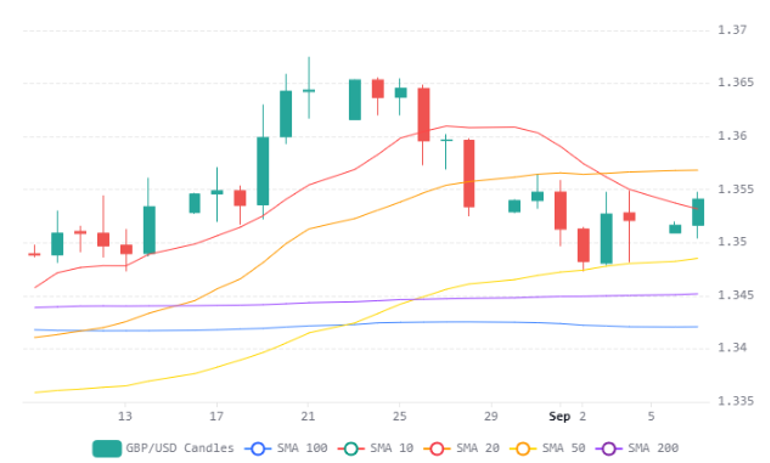
GBP/USD is trading around 1.3540 after grinding modestly higher within a tight 0.33% range, finding reliable support at the 1.3500 confluence where the 200-day, 50-day levels cluster, though the pair remains capped below the 20-day SMA at 1.3600, which has acted as a firm ceiling throughout the recent decline from the late-August peak near 1.3660. The daily RSI at approximately 52 reflects neutral momentum, leaving the pair vulnerable to a decisive catalyst in either direction.
The fundamental picture is dominated by diverging central bank expectations, with markets pricing a 57–65% probability of a Fed rate hike in September following a blowout August payrolls report, while the Bank of England faces its own inflation pressures as Brent crude surges toward $97 per barrel amid escalating US-Iran tensions in the Strait of Hormuz. The narrowing UK-US interest rate differential and COT data showing large speculators unwinding short sterling positions have provided structural support for the pound, but rising gilt yields — with the 10-year near 5.14% — and the first annual decline in UK house prices since late 2023 signal growing stress in the domestic economy.
This week's US PPI and CPI releases are the decisive event risk: a hot inflation print would likely cement a September Fed hike, strengthening the dollar and driving GBP/USD below the 1.3500 support toward 1.3421, while any moderation in core CPI could push rate-hike expectations back to December and open a path for cable to challenge resistance at the 1.3600 level. Geopolitical risk from the Middle East remains a wildcard capable of amplifying inflation pressures globally and injecting significant volatility into both the policy outlook and the pair's near-term trajectory.
Economic Calendar


