


EUR / USD
Source: Massive (polygon.io)
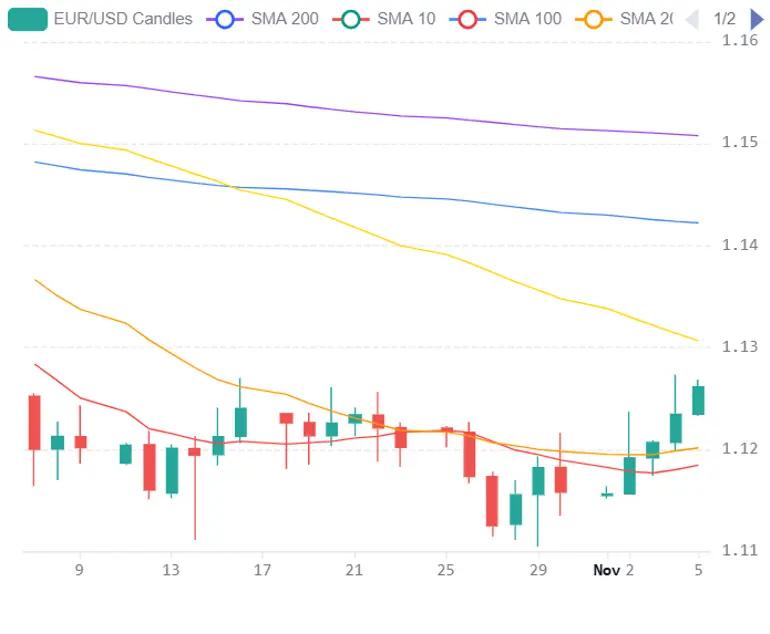
EUR/USD is currently benefiting from a weakening dollar following the Democratic sweep in the U.S. midterm elections, which has significantly reduced expectations for aggressive fiscal expansion and tariff escalation under the Trump administration. The resulting decline in the dollar index toward 101.2 and the drop in 10-year Treasury yields to around 4.87% have provided a meaningful tailwind for the euro, though rate differentials remain relatively supportive of the dollar in the medium term given the 81% market-implied probability of a 25-basis-point Fed hike in December.
On the European side, eurozone flash inflation surging to 4.0% — a three-year high — has cemented expectations for an ECB rate hike in December, but fading manufacturing momentum with the October PMI slipping to 52.7 presents the central bank with a difficult balancing act between tightening policy and preserving growth. Political risks in France, Spain, and Belgium, driven by fiscal concerns and rising populist pressures, add a layer of uncertainty that could constrain further euro appreciation.
From a technical perspective, the pair traced a clear intraday reversal pattern, rallying to 1.1273 during the London-New York overlap before selling off to 1.1213, then recovering to approximately 1.1261 by early Wednesday — a net gain of roughly 0.25% across the 24-hour window. Price now sits just above the 20-day SMA at 1.12 and the 30-day VWAP near the same level, both of which served as effective support during the pullback, while the 50-day SMA around 1.13 and the 200-day SMA near 1.15 remain overhead barriers capping medium-term upside. The daily RSI's recovery to approximately 55 from oversold readings in the low-to-mid 30s during October signals building bullish momentum following the bounce off the one-year low near 1.1115. The pair's near-term trajectory will likely hinge on Friday's nonfarm payrolls report and upcoming ECB policy signals, with a sustained hold above 1.12 opening a path toward the 1.13 resistance zone, while a breakdown beneath that support cluster would expose a retest of the late-October trough.
USD / JPY
Source: Massive (polygon.io)
EUR/USD is currently benefiting from a weakening dollar following the Democratic sweep in the U.S. midterm elections, which has significantly reduced expectations for aggressive fiscal expansion and tariff escalation under the Trump administration. The resulting decline in the dollar index toward 101.2 and the drop in 10-year Treasury yields to around 4.87% have provided a meaningful tailwind for the euro, though rate differentials remain relatively supportive of the dollar in the medium term given the 81% market-implied probability of a 25-basis-point Fed hike in December.
On the European side, eurozone flash inflation surging to 4.0% — a three-year high — has cemented expectations for an ECB rate hike in December, but fading manufacturing momentum with the October PMI slipping to 52.7 presents the central bank with a difficult balancing act between tightening policy and preserving growth. Political risks in France, Spain, and Belgium, driven by fiscal concerns and rising populist pressures, add a layer of uncertainty that could constrain further euro appreciation.
From a technical perspective, the pair traced a clear intraday reversal pattern, rallying to 1.1273 during the London-New York overlap before selling off to 1.1213, then recovering to approximately 1.1261 by early Wednesday — a net gain of roughly 0.25% across the 24-hour window. Price now sits just above the 20-day SMA at 1.12 and the 30-day VWAP near the same level, both of which served as effective support during the pullback, while the 50-day SMA around 1.13 and the 200-day SMA near 1.15 remain overhead barriers capping medium-term upside. The daily RSI's recovery to approximately 55 from oversold readings in the low-to-mid 30s during October signals building bullish momentum following the bounce off the one-year low near 1.1115. The pair's near-term trajectory will likely hinge on Friday's nonfarm payrolls report and upcoming ECB policy signals, with a sustained hold above 1.12 opening a path toward the 1.13 resistance zone, while a breakdown beneath that support cluster would expose a retest of the late-October trough.
GBP / USD
Source: Massive (polygon.io)
The GBP/USD pair is being driven by a powerful confluence of macro forces: a weakening US dollar following the Democratic sweep of both chambers in the US midterm elections, and a widely anticipated Bank of England rate hike from 3.75% to 4.00%. The dollar has come under broad pressure as markets price in a more constrained US foreign policy, leading to declining oil prices and lower Treasury yields, while persistent UK inflation—with CPI at an 11-month high of 3.5%—has compelled the BoE to act decisively.
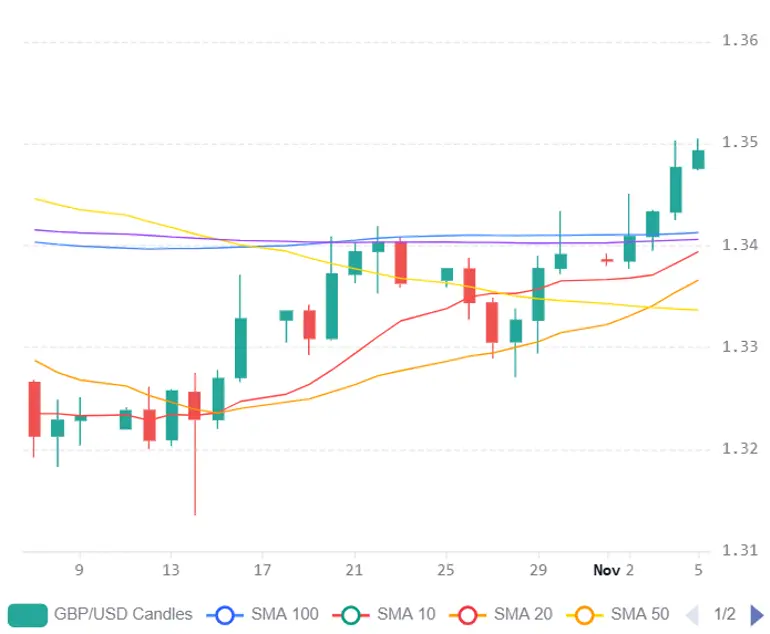
Technically, the pair is trading at elevated levels near 1.3492, sitting above all key moving averages including the 200-day SMA at 1.34 and the 50-day SMA at 1.33, while the daily RSI at 67 signals momentum is approaching overbought territory. A sustained break above the 1.3500 psychological barrier could open the path toward the August high near 1.3665, though failure to hold above 1.3460 risks a mean-reversion pullback toward the 200-day SMA.
The critical risk for sterling bulls lies in the forward guidance accompanying the BoE decision, as a dovish tone suggesting a one-and-done hike could temper momentum, particularly with market pricing for three to four additional hikes in 2027 appearing stretched. On the US side, the Federal Reserve's rate path remains largely intact with an approximately 81% probability of a December hike, and Friday's nonfarm payrolls report will be pivotal in determining whether the pound can sustain its recent gains against the greenback.

