


Summary
As we move through Q3 2025, tariff risks appear to be gradually unwinding. The US is closing in on a trade deal with Europe and is set to extend its truce for another 90 days with China, adding both economies to a growing list of trade agreements that already includes Japan and the UK. Expectations remain that other trading partners could still face tariffs between 15-30%, a range that we believe to be noticeable but not severe for US consumers. While August 1st remains a key date, the associated volatility is unlikely to match “Liberation Day” levels, as volatility exhaustion and tariff-related noise start to dilute market reactions during the summer period.
Although US inflation remains a key uncertainty, strong labour market and consumer spending data point to a resilient economy, reducing pressure on the Fed to cut rates in the coming months. This relative strength should help lift the dollar from recent lows, with resistance likely around the 102.00 level. As a result, rate cuts in the US may be pushed further into late 2025, while Europe's weaker economic outlook could increase the likelihood of ECB action. What will be particularly important are the forward-looking statements from each central bank, offering insight into how they plan to balance inflation risks with growth concerns.
From an industrial perspective, supply chain disruptions, particularly the front-loading of copper shipments to the US, have been key in driving the base metals complex higher. However, without a clear rebound in Chinese demand, the upside looks limited. With refined copper exemption, the copper trade seems has ran out of steam. Combined with our expectations for a stronger dollar, pressures on the complex are growing, which could result in moderate near-term weakness. Precious metals, while still supported by safe-haven demand, appear to be losing upside momentum, with holdings expected to remain stable but with a slower pace of growth.
Watch our Q3 2025 Metals Market Webinar
Aluminium
Aluminium tracks copper higher but remains capped near $2,700/t due to global oversupply and soft demand. US tariff effects are boosting Midwest premiums, though scrap imports provide only short-term relief. Without stronger domestic production or a demand rebound, LME prices are likely to remain range-bound in Q3, with tightening in the US market emerging more clearly in Q4.
Copper
Copper faces renewed pressure as US tariff exemptions for refined material prompted markets to discount the tariff premium on COMEX completely, easing fears of material scarcity. While LME inventories are tight, softer demand and a firmer dollar limit upside. As a result, copper is likely to stay capped below $10,100/t, with pressures on LME skewing increasingly on the downside.
Lead
Lead is struggling to hold above $2,000/t despite tightening mine supply and falling treatment charges. Primary and secondary production remain constrained, but weak downstream demand and seasonal battery softness cap gains. With concentrate imports providing limited relief and smelter margins narrowing, lead may stabilise near current levels, but upside appears restricted unless battery restocking picks up.
Nickel
Nickel prices are consolidating near $14,600–15,600/t as speculative interest builds, but oversupply and weak end-use demand continue to weigh on the market. Indonesian production stays high despite cost pressures, and LME inventories are still elevated. While funds have turned net long, soft demand from stainless steel and batteries limits upside.
Tin
Tin enters August supported by tight inventories and resilient demand from AI and electronics. LME stocks remain critically low, keeping the market highly sensitive to shocks. While supply from Myanmar is resuming, liquidity remains thin and positioning has turned more optimistic. We expect prices between $32,000-35,000/t.
Zinc
Zinc has lagged copper’s recovery, capped by oversupply risks and subdued construction demand in China. Inventory drawdowns have offered only brief support, while mine and smelter output are rising. With treatment charges climbing and SHFE prices softening, we expect zinc to remain under pressure through H2 2025, with limited upside unless copper momentum intensifies or Chinese demand unexpectedly improves.
Iron Ore
Iron ore recovered to over $105/t by late July as policy support, tighter availability, and falling port stocks improved sentiment. However, structural demand remains weak, steel margins are thin, and property sector activity is subdued. A revised surplus outlook and potential restocking provide support, but without stronger steel demand, we expect prices to remain range-bound between $97 and $105/t.
Gold
Gold trades between $3,280 and $3,450/oz, consolidating after April’s record high. Central bank and ETF demand continue to anchor support, but firm yields and fading safe-haven flows cap upside. With retail interest soft and Fed policy still cautious, we expect range-bound conditions to persist through Q3 unless a dovish shift or geopolitical shock revives momentum.
Silver
Silver nears $39/oz, fuelled by strong ETF inflows and speculative buying, though fundamentals remain mixed. Industrial demand is firm but uneven, while jewellery and investment consumption are weak. Rising mine supply and scrap flows are narrowing the deficit. Without a clear catalyst, we expect volatile two-way trade to dominate, with prices likely contained between $36 and $40/oz.
Platinum
Platinum holds above $1,400/oz, underpinned by speculative interest and relative value appeal. Supply is recovering, but the market remains in deficit. Automotive and jewellery demand stay firm, though macro caution lingers. ETF flows have softened, but positioning remains constructive. We expect range-bound trade between $1,350 and $1,500/oz through Q3, with intermittent rallies on supply or positioning shifts.
Palladium
Palladium is supported by rising ETF demand and short covering, but fundamentals remain weak. The market is expected to post a 900 Koz surplus in 2025, capping upside. Demand from petrol vehicles continues to erode, with hybrid use offering only partial support. We expect prices between $1,150- $1,300/oz in Q3, driven mainly by speculative flows.
Macroeconomic Outlook
Global Economy
The global economy enters Q3 2025 continuing to deal with Trump's policies and tariff dynamics, given that the deadline was brought forward to August 1st, impacting a great number of economies. In particular, the Trump administration has targeted a broad range of countries, with top trading partners, including recently exempted Canada and Mexico, facing tariffs of over 50% if trade agreements are not finalised.
Recent trade deals with Japan and Europe and a potential for an extended truce with China suggest that the administration is applying pressure on other nations to agree to US-preferred terms. It also seems that the remaining top exporters within the “Top 10”, including South Korea and India, are receiving a lower tariff rate, between 15% and 25%. This would serve as the first step to establish alignment on broader tariff frameworks before moving into the finer details in subsequent discussions.
Major Economies Inflation
US inflation remains sticky, putting pressure on the Fed to hold rates steady. 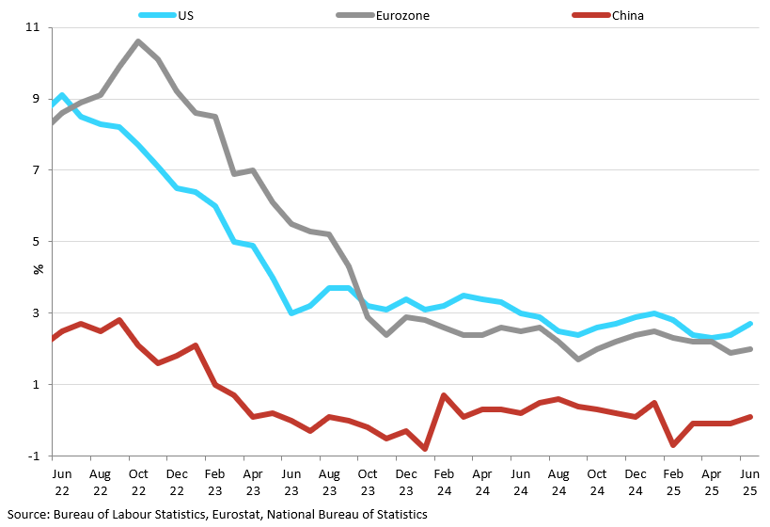
However, for smaller exporters, we believe tariff negotiations may drag on, with elevated rates remaining in place. This would keep the administration’s “America First” narrative intact while increasing pressure on these economies to engage in talks and securing trade deals.
With major agreements secured, a key trend now emerging is that tariff-related headlines are increasingly being treated as noise. As a result, market focus is likely to shift back toward macroeconomic and fundamental indicators, particularly central bank decisions, as investors look for signals on how policymakers will respond to the current trade landscape and existing tariff burdens.
Oil
Oil prices have been volatile in recent months, driven primarily by escalating Middle East conflict and OPEC+ policy shifts. In particular, Israel-Iran conflict flare-up prompted Brent to jump by around 30%, touching $80/bbl before settling back near $67/bbl in late June. Despite this, we believe the overall rally was somewhat capped as markets quietly exited long positions amid broader market fatigue from tariff uncertainty.
On the supply side, OPEC+ accelerated output, raising production by about 411,000 bpd in June and intending similar moves into August to meet demand despite rising inventories. According to the IEA, the demand picture is deteriorating, with June supply of 105.6 mb/d surpassing demand, which is forecast to grow by just 700 kb/d, the weakest since 2009. In the US, oil inventories have risen modestly even as internal demand shows signs of weakening.
While price momentum benefited from supply disruptions in the Middle East, we expect downward pressure to build later this year as oversupply becomes more pronounced. Looking ahead, oil will likely trade within a $65–75 range, with upside limited unless geopolitical tensions intensify. Downside risks are rising as OPEC+ unwinds cuts further and global demand growth softens.
US
The US outlook has been under growing pressure in Q2 2025, weighed down by political uncertainty, the continuation of trade tensions, and mounting fiscal concerns. The Trump administration is poised to implement a sweeping wave of tariffs starting August 1st, including general tariffs of 15-20% affecting a wide range of goods. Although trade deals and truces are moving forward with the EU, Japan, and China, the looming tariff deadline raises significant uncertainty for many other countries.
Markets are also growing uneasy about the US's worsening fiscal outlook, with debt now over $36 trillion, with the biggest concern being centred on Washington's inability to implement credible long-term reforms. Moody’s credit downgrades, higher borrowing costs, and rising Treasury yields only add to the pressure. These are shaking confidence in US fiscal sustainability, which could have longer-term consequences for the dollar and ripple across global markets.
US Trade Balance vs Import Prices
The recent deficit decline reflets businesses dialling back on front-loading prompted by earlier tariffs. 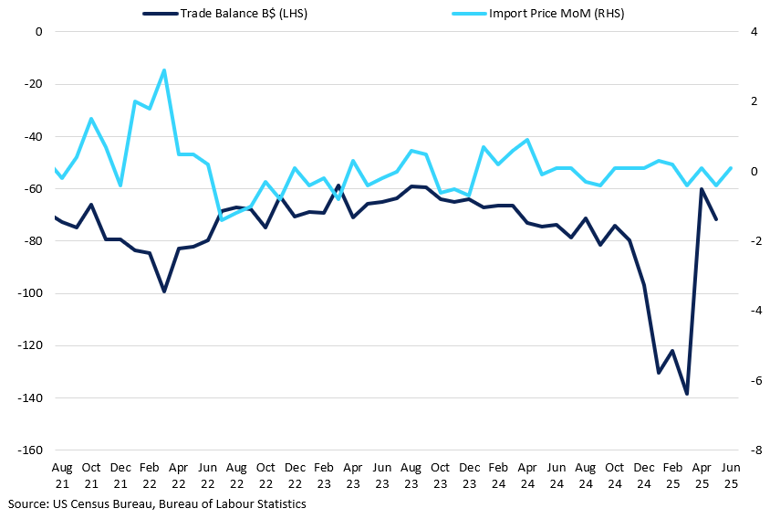
However, as tariff risk premium fades into background noise, market focus is shifting back to individual economic performance, and the US remains relatively strong. The labour market remains healthy, with unemployment falling to 4.1% in June, and consumer spending continues at solid levels, as reflected in retail sales of 0.6% MoM. The key uncertainty now lies in how tariffs will affect inflation over the rest of the year.
Assuming an average tariff rate of 15–25%, the impact on consumers is tangible but not severe. For now, importers are absorbing part of the cost and cautiously passing on the rest, reluctant to sharply raise prices amid ever-changing trade policy. Once tariff levels stabilise, producers are likely to pass on more of these costs. However, this will take time, likely filtering through to consumers closer to year-end, assuming no further shifts in trade policy. Tariff volatility may ease, but inflation risks persist, keeping the Fed cautious and delaying rate cuts into the end of 2025 and 2026.
We expect the Fed to cut rates by 25–50bps in H2 2025, with the second cut likely only if inflation shows clear signs of deceleration. While this sets up a moderately bullish narrative for the US dollar, broader tariff uncertainty is likely to act as a headwind. As a result, the dollar may struggle to break above the 102.00 resistance level through the end of the quarter. Over the longer term, however, we believe the dollar is positioned to strengthen, but that outlook depends heavily on inflation trends and trade policy stability.
Europe
The eurozone underwent a notable shift in Q2, with markets increasingly turning to the euro as an alternative to the US. Since Trump's inauguration in late January, EUR/USD has surged by more than 13%, reaching a September 2021 high of 1.18 in June. This rally was driven by a combination of factors: investors hedging against dollar volatility and safe-haven risks, along with the eurozone's relatively stronger fiscal positioning than the US.
Now, the tide seems to be turning away from Europe, as the US-EU trade deal nears completion. In the last week of July, Washington and Brussels reached a trade deal, imposing a 15% tariff on most EU goods, half of the initially threatened rate, helping to ease tensions between the two trading blocs. In return, the EU has pledged to purchase roughly $750 billion in US energy products and military equipment over the next three years. The euro weakened on the news, with the EUR/USD falling below 1.164, as markets discounted the tariff risk premium.
EU Exports to the US (2024)
With exemptions granted for selected chemical and general pharmaceuticals, the 15% tariff might ease some of the significant burden on EU exports.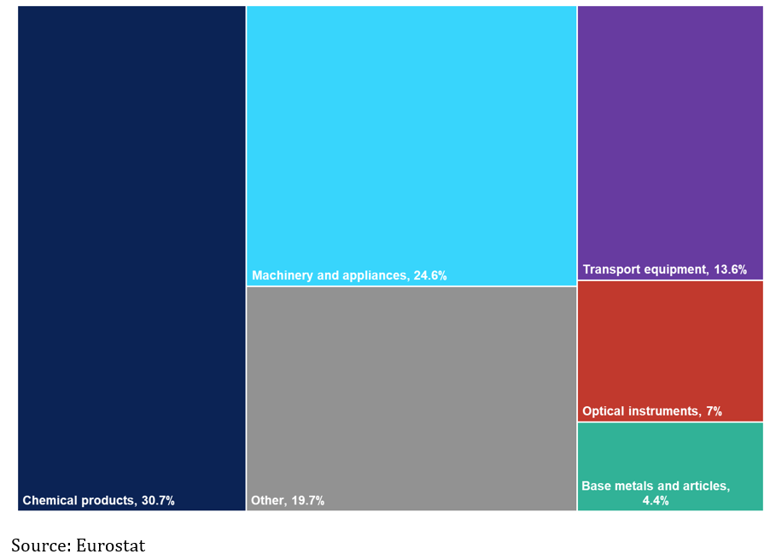
While Europe still enjoys greater sovereign safety, the economic performance reveals a different dynamic, which could alter the tide of euro strength later this year. The Eurozone's GDP expanded by 0.6% QoQ in Q1 2025, and inflation has fallen to the ECB's 2.0% target. However, the outlook remains fragile. The GDP growth was partly driven by businesses and exporters front-loading activity to evade anticipated US tariffs. That could yet reverse. Current tariff pressures and sluggish global demand are already weighing on momentum, with risks skewed moderately to the downside. Despite record-low unemployment and price stability, the euro area is expected to grow just 0.8% in 2025 (IMF), underscoring the limits of the current recovery.
As the Fed monitors tariffs before adjusting its policy, the ECB is already nearing the end of its cutting cycle thanks to easing inflationary pressures. This puts the ECB in a strong position: it can pause if conditions stabilise yet retain flexibility to ease further should growth deteriorate. While the ECB projects inflation will fall below the 2.0% threshold next year, the case for stronger interest rate cuts might arise later in the year should economic performance show signs of weakness, especially in light of a 15% tariff rate imposed by the US.
China
At the beginning of Q2 2025, China found itself at the centre of global tensions due to escalating trade negotiations with the US. The Trump administration initially raised tariffs to 150%, likely as a strategy to pressure China into compliance. In response, China implemented a 130% levy. Over time, however, markets reacted positively to news of a trade framework between China and the US. A truce was established, which is now set to extend for another 90 days, providing much-needed relief for the markets. While not all the details of the agreement are clear, it reaffirms terms discussed during trade talks between Beijing and Washington, including China's commitment to supply rare earth metals that are crucial for various industries, ranging from wind turbines to jet planes. With these issues seemingly resolved, market focus is shifting back to muted growth prospects that have kept demand for base metals subdued.
China has been front-loading its exports to the US in anticipation of an August 12th deadline, with June figures showing exports rise by 5.8% YoY. With the truce likely to be extended for another 90 days, exports to the US are expected to continue at a healthy pace.
China PPI vs CPI YoY
Despite the recent uptick in consumer prices, the pace of inflation growth suggests muted domestic demand.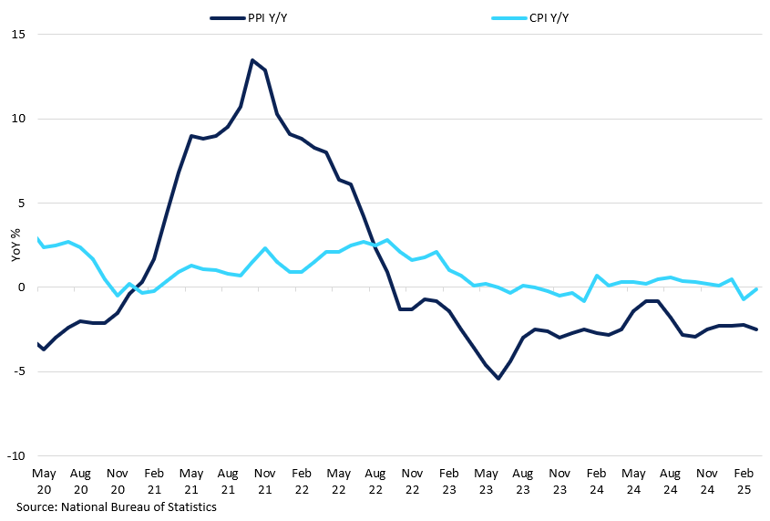
On the home front, growth remains moderate. Q2 GDP is healthy at 5.2% YoY, but down from 5.4% in Q1, keeping first‑half growth around 5.3%. Consumer inflation just ticked positive again in June, at 0.1% YoY, but producer deflation deepened to -3.6%, marking nearly two years of negative PPI as domestic demand stays weak. The persistently sluggish property sector, alongside soft retail sales and investment, continues to weigh heavily on overall domestic momentum. These headwinds are placing added pressure on Beijing to deploy fresh stimulus, though recent policy support has yielded only limited improvement in sentiment.
Aluminium
Key Points
- Aluminium tariff story offers a useful parallel for analysing forthcoming tariffs on copper.
- For now, scrap imports and previous front-loading efforts are supporting marginal demand.
- However, tightness could reappear again closer to the year-end, driving domestic premiums higher, while LME price potential is capped given the global oversupply.
Aluminium continued to mirror copper's trajectory, rebounding from the selloff on "Liberation Day" and nearing $2,700/t by the end of July, as the broader base metal complex strengthened and retested recent highs. Aluminium is the only metal that has been felt the brunt of US tariffs, offering insight into the potential impact on copper when similar measures take effect on August 1st. On February 10th, the Trump administration raised aluminium tariffs to 25% and then doubled them to 50% in June, offering no exemptions for the largest aluminium exporters to the US: Canada and Mexico.
LME Investment Funds Net Total vs 3-month Price
Fund positioning in aluminium has steadily rebuilt through Q2 2025.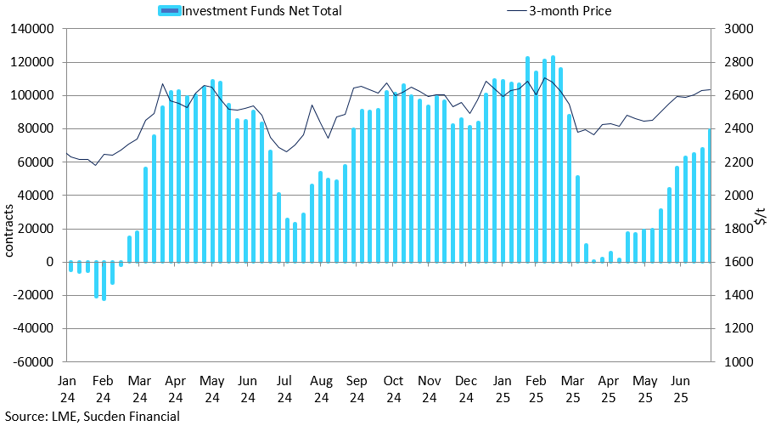
The LME aluminium does not reflect the US tariff structure, since the exchange’s pricing does not include shipping, delivery, and VATs – costs that are specific to US imports. Instead, the impact of tariffs is showing up in the US Midwest premium, which surged to $1,470/mt over the LME following the additional tariff hike in June. As a result, following stockpiling efforts in March, US aluminium imports dropped sharply in April to just 339,000 tonnes, down 23% YoY as the result.
Instead, given the tariff exemption for scrap, scrap imports into the US rose by 30% in Q1 2025 as recyclers capitalised on favourable pricing dynamics. While this is sufficient to sustain marginal demand increases, without a meaningful increase in domestic production, it is unlikely to be sustainable in the long run. In 2024, about 50% of all US aluminium consumption was met through imports, with Canada alone exporting 3.2m tonnes. Indeed, despite the Trump administration’s intent to boost domestic output through tariffs, the policy may end up having the opposite effect.
Since multiple tariff hikes this year, few smelters have resumed production, indicating that current capacity constraints remain firmly in place. For instance, Alcoa’s San Ciprián restart is progressing slowly, and no other large-scale re-openings have occurred so far. Domestic US production has been steadily declining over the past two decades, falling to 670,000 tonnes, due to continued challenges of high energy costs and competition for power. Unsurprisingly, downstream sectors such as automotive, aerospace, packaging, and consumer goods have pushed back—reporting margin pressure, rising input prices, and deferred investment as a direct consequence of constrained supply and persistent import reliance.
LME aluminium is unlikely to reflect US tariff-driven tightness given that global markets are well-supplied, with a projected surplus of 390,000 tonnes. Unlike copper, aluminium is more easily substituted with scrap, keeping inventories stable and dampening broader market pressure, even as US premiums surge. However, if inventories draw down at 40–60kt/month, and imports stay weak, the US could face material tightness by late Q3 or early Q4 2025. Premiums may surge again if consumers start to stockpile or hedge ahead of scarcity.
Q3 Outlook:
We believe aluminium will continue to track copper, though the upside appears capped around $2,700/t. For now, US buyers are absorbing higher import costs, partly passing them on to consumers and partly relying on inventory buffers. This is not sustainable long-term, and pressure to secure material will likely increase, particularly through scrap and refined flows. As year-end approaches, this could drive premiums higher, though LME prices are unlikely to reflect and will likely follow copper’s broader momentum.
Copper
Key points
- The exclusion of refined materials from tariffs has significantly diminished the argument for tightness on the COMEX, effectively removing most of the tariff premium in the US.
- This has exhausted the copper trend that had been developing throughout much of this year, weakening the case for future shipments to the COMEX unless there is a marginal increase in physical demand.
- With tariff-related supply concerns erased and no meaningful demand recovery, near-term pressure on LME prices is skewed to the downside.
Copper started Q2 2025 on a strong note, rebounding from an April low of $8,500/t to reach the April high of $10,000/t, supported by strong COMEX front-loading momentum that has helped lift the broader base metals complex as markets assessed the impact of US trade policy. Since February, growing fears over potential copper tariffs prompted a surge in shipments to US exchanges, with around 160,000 tonnes moved to COMEX so far this year. The formal tariff announcement in July sparked sharp volatility, widening the COMEX/LME arbitrage to 34%, a significant jump from 15% earlier in the month, though still short of the proposed 50% levy.
LME and COMEX Investment Side COT Net Positioning
The recent refined copper exclusion from US tariffs is likely to show major unwinding on COMEX longs. 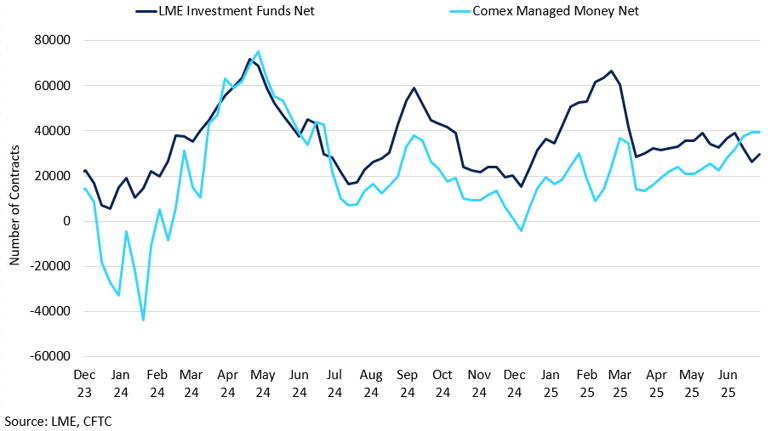
The momentum shifted significantly on July 30th, when the Trump administration announced the exclusion of refined copper from US tariffs, which is the most imported form of copper into the US. This decision led to a significant decline in COMEX copper futures, erasing as much as 20% in a single day, as the markets largely discounted the impact of tariffs. This is likely to contribute to further weakness in copper prices on the LME in the near term, with the support at $9,500/t as a key threshold. This development would significantly ease delivery pressures to US inventories, causing the arbitrage to remain mostly close to zero.
This exemption is particularly important given the US's heavy reliance on copper imports. With domestic production of just 850,000 tonnes, compared to annual demand of 1.6 million tonnes, the shortfall means the US would need to continue steady imports. Even if new investments start now, building a smelter typically takes 5-8 years, well beyond the current presidential term. Moreover, with US trade policy shifting frequently, investor confidence in long-term smelter projects remains low, making large-scale capacity additions unlikely in the near term.
These developments could weigh on LME prices, especially as redirected inventories, a stronger dollar, and reduced arbitrage-driven demand are not being offset by sustained improvement in demand. This disconnect is notable given that LME inventories have dropped 60% in 2025, which should traditionally signal tightness and support prices. While spread tightness has now subsided, shipping activity to the US is likely to return to normal following the front-loading implemented earlier this year for the US. As a result, we expect new shipments for COMEX will not be until inventory levels begin to dwindle, which will likely occur later this year.
Q3 Outlook:
With tariff-related supply concerns erased and no meaningful demand recovery, near-term pressure on LME prices is skewed to the downside. We expect prices to be capped by $10,100/t resistance level – a break above which could be brought by demand expansion rather than supply issues. Despite persistently low treatment charges over the past year, LME pricing has largely overlooked supply-side risks. In the near term, the COMEX/LME trend has now run out of steam and incentive, but it's essential to monitor inventory shifts between exchanges to understand the real impact on physical availability.
Lead
Key points
- We expect the cost-of-production support of $2,000/t to solidify in the coming months.
- Meanwhile, the presence of technical resistance and improved secondary supply conditions are likely to limit any substantial upside sentiment.
- For now, lead continues to shadow copper, and a narrower surplus is helping to mitigate any downside from a fundamental standpoint.
Lead prices have been gradually recovering from their April lows following the “Liberation Day” selloff. However, this recovery has been sluggish, particularly given lead’s cyclical nature in relation to lead-acid battery trends in China. This lacklustre recovery has kept prices struggling to break above the key $2,000/t in Q2 2025 – a critical level for smelter margins as it closely reflects production costs. As of July, the metal is hovering around this level, with the market still searching for direction heading into the remainder of the quarter.
Lead Concentrate 50% CIF vs Sulphuric Acid
Lead treatment charges collapsed below zero in Q2 2025.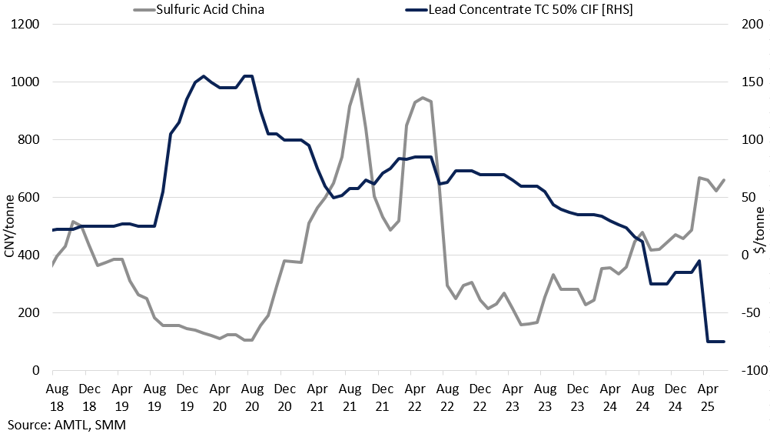
From a fundamental perspective, primary smelters are closed from June to August, limiting the availability of refined material. In June, production continued to fall, down 0.7% MoM and 16.2% YoY, bringing cumulative output for H1 down 9.7% YoY, according to SMM. While the decline was less severe than expected, thanks to elevated prices supporting smelter margins, global mine supply recovery remains sluggish. This may not result in immediate tightness due to ongoing maintenance, but from August onward, tightening supply could begin to lift SHFE domestic prices and eventually support LME gains.
Adding to the pressure, lead TCs have been steadily declining, reflecting tighter concentrate availability and further squeezing smelter profits. In recent mine-smelter negotiations, negative TCs have emerged, with reported deals struck at rates between –$80 to –$100/mt. Smelters have only been willing to accept these negative TC rates due to the rise in silver prices, which has helped widen their profit margins. China has increasingly turned to importing lead concentrate to secure feedstock, despite high costs, further underlining the supply strain that could tighten refined lead output in the months ahead. According to customs data, China imported approximately 104,000 mt of lead concentrate in May 2025, bringing the year-to-date total to 552,600 mt, up 64% YoY.
Overall, as new concentrate supplies arrive, particularly through imports, TCs may gradually recover toward zero or lightly positive levels. However, without a meaningful rebound in mine output, negative TCs are likely to persist, maintaining pressure on the concentrate supply chain. Smelters could face sharper raw material challenges, especially if silver-driven margins narrow, reducing their willingness to accept unfavourable terms. While concentrate imports offer some relief, they are a temporary buffer, and not a long-term solution to the structural supply imbalance.
From the perspective of secondary producers, there is a willingness to expand; however, prices are limiting this growth. In June, production declined by 2.4% MoM and 13.5% YoY. High raw material costs, combined with weak demand from downstream markets, have led to a significant drop in secondary lead production. Currently, during the off-season for battery collection, secondary material collection rates are low, which is pushing prices higher and squeezing profit margins for secondary smelters. As a result, smelters are operating at a loss.
Q3 Outlook:
Demand for lead-acid batteries in Q3 2025 is expected to remain flat, keeping the market’s focus on the supply side. We expect the $2,000/t level to hold as a cost-of-production support, but see limited upside beyond $2,100-2,150/t, constrained by both technical resistance and additional supply from secondary smelters. Battery manufacturers may begin stockpiling ahead of winter, lending some support to Q4 2025; however, with softer battery demand and overall seasonal downturn in China’s economic activity, the upside might be limited. Overall, this points to a neutral to slightly bullish price bias, with Q4 potentially offering clearer fundamental signals.
Nickel
Key Points
- Funds are net long, but prices remain range bound near $14,600–15,600/t amid weak fundamentals.
- Indonesian output stays high as cost pressures have not triggered significant supply cuts.
- Demand remains soft and inventories elevated, limiting upside despite speculative interest.
Nickel entered Q3 2025 trapped between growing speculative interest and stubborn fundamental headwinds, with prices likely to remain range bound as oversupply and sluggish demand continue to weigh on the market. Investment funds have recently shifted to a net long position in nickel futures, historically a signal of potential price upside. If macro sentiment improves, particularly through a broader recovery in industrial metals, nickel could see a short-term rally from sub-$15,200/t levels. However, such moves are likely to be limited and short lived given the underlying market imbalance.
Nickel LME Stocks vs Cancelled Warrants vs Nickel Ore at Chinese Ports
Nickel stocks rise as ore imports and cancelled warrants stabilise.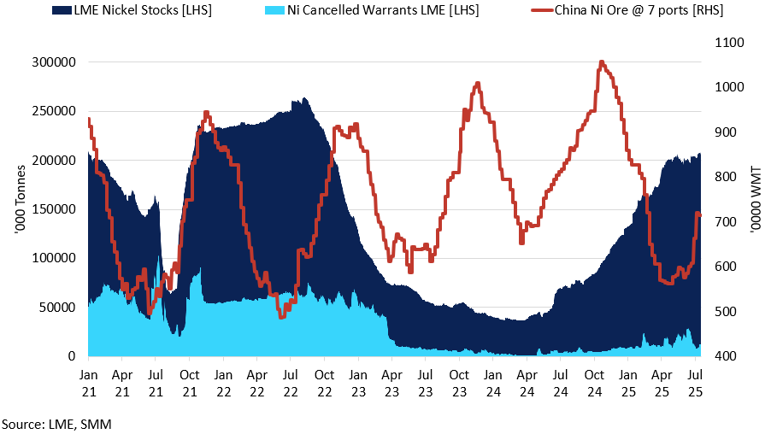
Indonesia remains the central force shaping global supply. Despite rising production costs, including higher ore prices and increased refining royalties, output has remained resilient. Several marginal producers, particularly those using rotary kiln electric furnace technology, have suspended or curtailed operations due to extremely thin margins. These disruptions, however, remain modest and have not meaningfully altered the broader surplus. Government quotas remain intact, and no formal production cuts have been announced, making supply-driven price support unlikely in the near term. Meanwhile, the continued ramp-up of high-pressure acid leach operations is adding pressure to the supply of battery grade material.
On the demand side, conditions remain subdued. Stainless steel production in China, which accounts for the bulk of global nickel consumption, continues to underperform seasonal expectations. Downstream margins are weak, property construction activity remains soft, and restocking interest has been minimal. In the battery sector, manufacturers are steadily shifting toward cheaper lithium iron phosphate chemistries, reducing demand for nickel-rich cathodes in mass market EVs. Although high nickel formulations are still used in premium segments, the broader demand picture has softened. Without a material improvement in Chinese infrastructure or manufacturing activity, nickel consumption is unlikely to recover meaningfully in the near term.
LME inventories remain elevated above 200,000 tonnes, reinforcing the perception of ample supply. Although cancelled warrants have increased and speculative fund interest has turned more constructive, there has been little evidence of sustained physical drawdowns. This suggests that recent price movements are being driven more by sentiment and positioning than by consumption.
Q3 Outlook:
Nickel prices may find some near term support from rising cost structures and speculative inflows, but the broader outlook remains constrained by oversupply and weak end-use demand. We expect prices to consolidate between $14,600- $15,600/t range, with short-lived rallies possible on positioning shifts or headline risk. Without a significant disruption to supply or a meaningful revival in demand from stainless steel or battery sectors, sustained upside remains unlikely through September.
Tin
Key Points
- Tight inventories and thin liquidity keep the market vulnerable.
- Net long positions have grown, leaving the market exposed to sharp moves.
- Demand from AI and electronics remains firm.
After a sharp rebound in the first half of the year, tin enters Q3 2025 with momentum tempered by a fragile supply recovery and persistently low inventories. Mining activity in Myanmar’s Wa State has resumed following a two-year suspension, while output in Central Africa continues to stabilise, improving ore flows into China and easing some of the acute tightness seen earlier in the year. However, LME stocks remain critically low, still below 2,000 tonnes, leaving the market highly sensitive to even minor disruptions. With speculative interest firm and liquidity conditions thin, tin remains vulnerable to sharp price swings in either direction, particularly if macro sentiment improves or supply setbacks return.
Tin LME Stocks vs Cancelled Warrants vs SHFE Stocks
LME stocks remain low, keeping the market sensitive to supply shocks.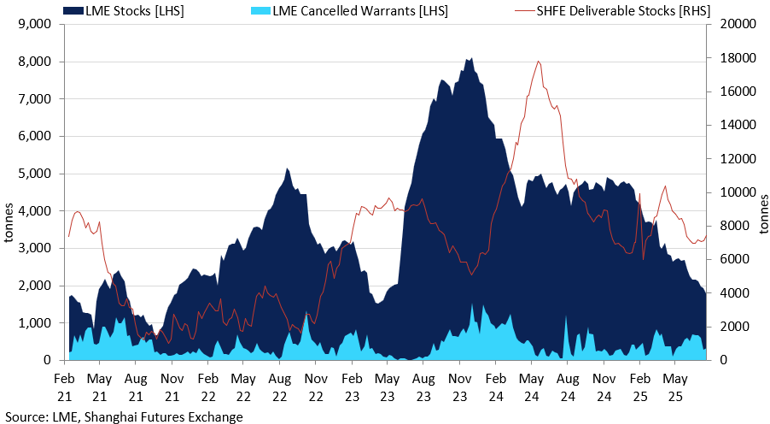
Fund activity has shifted in a more optimistic direction, with a moderate increase in net long futures and managed money net length rising to 3,354 contracts as of 18 July. Long futures and managed money net length rising to 3,354 contracts as of 18 July. While this is not an extreme level historically, it does reflect a shift away from the more cautious stance seen in Q2. Short positions have contracted slightly, indicating some reduction in downside conviction but not yet a decisive reversal. Overall, positioning remains balanced, leaving the market sensitive to any bullish catalysts such as unexpected supply disruptions or a quicker than expected improvement in demand from electronics or industrial sectors. In a market where liquidity remains thin and speculative exposure is gradually rebuilding, even relatively modest shocks or surprises could provoke outsized price reactions, reinforcing tin’s reputation as one of the more volatile industrial metals.
On the demand side, tin continues to benefit from its crucial role in sectors such as semiconductors and soldering materials, which are essential for AI infrastructure, cloud computing, and consumer electronics. While structural demand in these areas remains intact, recent indicators point to uneven momentum. Global semiconductor sales increased by around 20% YoY in May, driven by continued investment in data processing and artificial intelligence applications. However, broader industrial activity has shown mixed signals, with manufacturing output stabilising but new orders and export demand still under pressure.
Looking ahead, market attention is likely to shift toward the supply side, where fundamentals may evolve significantly as Myanmar resumes tin exports. With investor positioning building and visible inventories remaining tight, prices could remain sensitive to both sentiment and any confirmed supply increases. A more balanced tone may emerge in the coming weeks, as the market weighs firm strategic demand against the prospect of improving availability.
Q3 Outlook:
Although early signs of supply normalisation are emerging, tin’s inventory position remains exceptionally tight by historical standards, with LME stocks still well below long-term averages. The combination of very low visible inventories and growing speculative interest is likely to keep upward price risks elevated through the remainder of Q3. We expect prices to remain volatile between $32,000-35,000/t. With the market already finely balanced, sharp upward moves remain possible if physical supply tightens once again or if strategic demand, accelerates more quickly than expected.
Zinc
Key Points
- With zinc still lagging copper in its post-April recovery, prices are likely to remain volatile, with potential for sharp swings in either direction.
- Zinc is likely to follow copper in the coming months, but a more pronounced oversupply narrative should cap any significant upside.
- Although declining LME inventories point to limited visible supply, a weakening construction outlook in China.
Zinc remained under pressure through most of Q2 2025, lagging behind copper’s sharper recovery following the “Liberation Day” selloff, despite both being by-products of the same ore. Zinc struggled to break above the $2,800/t level, only managing to do so in late July. This recent upside appears to be a catch-up move, as copper returned to pre-“Liberation Day” highs while zinc underperformed. However, the recent upside seems largely speculative rather than a reflection of a shift in zinc’s own supply-demand fundamentals.
China’s TCs for Imported and Domestic Zinc
Zinc treatment charges in China have rebounded sharply in 2025.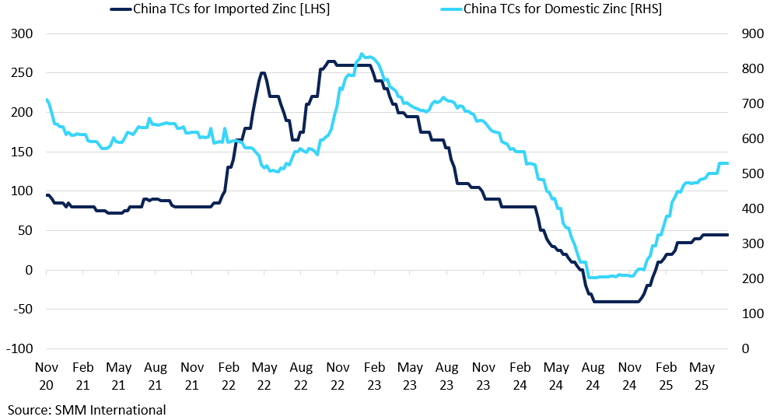
One key factor limiting zinc's upside has been LME inventory dynamics. In April, inventories spiked sharply to X within a few days, dampening market tightness concerns. While stockpiles gradually drew down over the quarter, the earlier build-up eased any immediate supply stress. By July, available inventory dropped to a multi-year low of 100,000 tonnes, briefly supporting prices, though restocking soon followed. Despite this, inventory levels remain historically low, offering some price support around $2,700/t.
On a fundamental side, demand remains muted, especially from the construction sector, while supply pressures are easing. Global mine output, particularly in China and Australia, has remained subdued. Meanwhile, overseas smelters cut production following the April price drop to protect margins. Still, with supply expected to grow and demand remaining soft, zinc’s upside potential looks capped in the near term.
Despite disruptions at Kipushi in Q2, zinc supply is expected to continue to rise in the second half of 2025, with the mine maintaining its annual production guidance unchanged at 180,000-240,000mt in metal content. In China, the Huoshaoyun mine continued to ramp up production, bringing a significant increase in domestic zinc ore output. By June, most domestic production that had been offline had resumed, which should bring overall output higher in Q3 2025. This growing supply is likely to weigh on domestic SHFE zinc prices in the coming months. Treatments charges have responded accordingly, with domestic charge rising from $200/mt to $550/mt, reflecting improved concentrate availability and easing smelter margin pressure.
Considering the seasonal pattern of domestic zinc mine operations, production is expected to continue recovering through Q3, likely peaking in August. By the year-end, the start of peak maintenance season begins, suggesting output would eventually decline. As a result, zinc mine production in H2 is expected to rise initially, then taper off. From January to May, zinc concentrate imports rose 52% year-on-year. Looking ahead, although current smelter demand for imports is subdued, the ongoing ramp-up in domestic smelting activity, coupled with the gradual delivery of long-term import contracts, is expected to keep zinc concentrate imports elevated through H2 2025. Demand in China also remains sluggish from the construction perspective. Currently, China is in the off-season for consumption, indicated by growing zinc ingot inventory.
Q3 Outlook:
Current fundamentals point to expanding smelter output, which should weigh on domestic SHFE prices and, by extension, the LME in the coming months. Weak demand in China continues to pressure the market balance, with a supply surplus likely to persist through 2025. Combined with our expectation of a stronger US dollar, this makes a sustained break above the April high of $2,800/t unlikely. While any copper-driven momentum could offer short-term support, the upside for zinc remains limited.
Iron Ore & Steel
Key Points
- Iron ore rebounded above $105/t in late July.
- Weak property and manufacturing activity continue to weigh on mill margins and limit sustainable restocking appetite.
- With a narrowed surplus and policy tailwinds, prices are likely to remain in the $97–105/t range unless downstream steel demand improves.
Iron ore entered Q3 with momentum rebuilding, as seasonal policy tailwinds and tighter spot availability helped lift prices from June lows to over $105/t by late July. Chinese steel output has held up more firmly than expected, while port inventories have declined steadily, creating space for restocking. However, underlying structural demand remains soft, and mill margins are still under pressure. We expect any upside to remain modest unless a meaningful improvement in downstream consumption emerges.
China’s crude steel production dropped 3.9% MoM and 9.2% YoY in June, marking the steepest annual decline in nearly twelve months. The property sector remains in contraction as stimulus measures haven’t managed to translate into sustained gains in manufacturing or construction activity. Steel mills are exercising greater caution, limiting purchases and monitoring inventory closely. Support from infrastructure spending may provide some relief in select regions, yet the overall consumption picture remains too soft to support a sustainable rally in iron ore.
Supply conditions remain broadly balanced. Shipments from Australia and Brazil continue at steady levels and a recent downward revision of the 2025 surplus outlook to 20 to 30m tonnes, from an earlier estimate of 50m tonnes, has helped ease immediate oversupply concerns. Meanwhile, Chinese port inventories have declined from 150m tonnes in January to around 132m tonnes by early July. This inventory drawdown creates room for restocking and helps underpin support in the event of further price weakness.
Policy signals from Beijing have offered tactical support in recent weeks. At a July 1 meeting of the Central Finance and Economics Commission, Chinese leadership reiterated its commitment to curb disorderly price competition and phase out inefficient capacity across sectors including steel. These measures build on recent draft pricing law amendments that target firms involved in predatory pricing and aim to accelerate the exit of obsolete operations. Some regional steelmakers have already responded, initiating modest output cuts. If sustained, these reforms could support improved margins at the mill level and buoy demand for higher grade iron ore over time.
Q3 Outlook:
In our view, iron ore is likely to remain range-bound through Q3, trading between $97 and $105/t. While the risk of a sharp correction appears limited by tight inventories and potential restocking activity, a sustained rally is unlikely without a more pronounced recovery in Chinese steel demand. The market remains delicately balanced between near-term supply restraint and longer-term structural headwinds.
Gold

Key Points
- Gold trades in a $3,280–3,450/oz range as risk appetite tempers safe-haven demand.
- Central bank and ETF buying anchor strong support despite softer retail interest.
- Fed hesitation and firm yields cap upside in the absence of fresh catalysts.
Following a record-breaking rally in April, gold entered Q3 2025 in a consolidative phase. Prices remain below the all-time high of $3,500/oz reached in response to the Liberation Day tariffs, with the market now adjusting to a more familiar geopolitical and macroeconomic backdrop. Risk appetite has returned, equities are posting record highs, and the fear-driven flows that powered gold’s ascent have moderated. While the price has held above key support levels, a lack of new catalysts has limited follow-through buying.
COMEX Gold Managed Money Positioning
Managed money gold positioning remains elevated but has moderated from early 2024 peaks, reflecting a more cautious investor stance.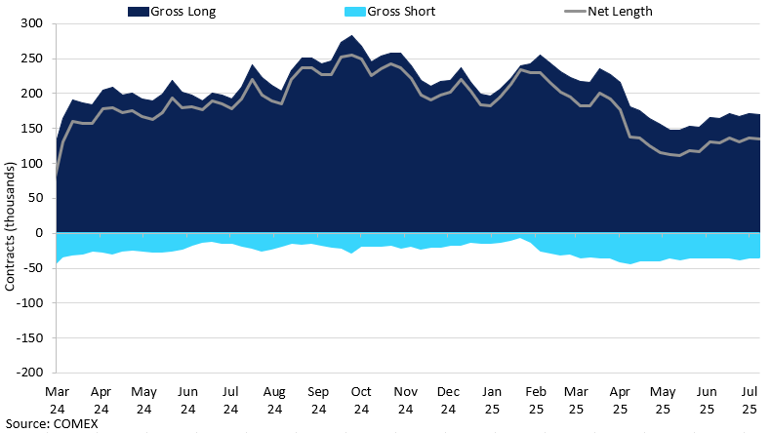
Central bank demand continues to provide a strong foundation. Official sector purchases are on track to exceed 1,000 tonnes for the fourth consecutive year, reflecting a persistent shift in reserve strategy. The latest World Gold Council survey indicates that nearly half of central banks plan to increase gold allocations, the highest share on record. This trend has reinforced a price floor around $3,280/oz, even as speculative flows fluctuate.
Investment demand has also remained resilient. Gold ETF holdings have climbed to their highest level in more than two years, nearing 92moz. This reflects renewed appetite among financial investors for gold exposure, particularly as a portfolio hedge against geopolitical uncertainty and fluctuations in currency markets. Futures positioning is elevated but not overstretched, allowing for additional inflows if macro conditions turn more supportive. However, this also introduces downside risk if expectations around monetary policy or geopolitical stability shift abruptly. Retail demand has shown signs of fatigue in recent months, particularly in key consumer markets where elevated prices appear to be weighing on discretionary buying. Indian imports fell by 30% YoY in H1 2025, suggesting that price-sensitive buyers are stepping back from the market. This points to increased caution among marginal buyers and limits the scope for fresh demand at current price levels.
Shifting expectations around US monetary policy continue to play a central role in shaping gold’s near-term trajectory. Inflation risks tied to Trump’s tariff regime have made the Fed more hesitant to cut rates, despite expectations for up to 50bps of easing by year end. Treasury yields remain elevated, with the 10-year note holding near 4.4%. This level of real yield continues to present a headwind for non-yielding assets like gold, particularly when growth expectations are stable and risk sentiment is improving.
Silver
Key Points
- Silver trades near 39 dollars per ounce, driven by strong ETF inflows and stretched speculative positioning.
- Industrial demand is firm but uneven, while jewellery and silverware remain weak.
- Rising mine output and recycling are narrowing the deficit, limiting fundamental support.
Silver enters August trading near $39/oz, at highest levels in years, following a steep and technically driven rally over the past month. ETF holdings have surged, indicating strong appetite from both institutional and retail investors. This inflow has contributed to the sharp price move, but with speculative positioning now heavily skewed to the long side, the rally appears increasingly vulnerable to correction. While technical momentum remains supportive in the short term, there are rising concerns that without a more supportive macro or fundamental backdrop, the rally may struggle to sustain itself.
Recent gains in silver have been fuelled largely by momentum and speculative positioning. Retail participation has surged, supported by algorithmic and momentum-based strategies reacting to technical breakouts. As a result, futures positioning is now heavily skewed to the long side, with non-commercial net length near multi-month highs. This leaves the market vulnerable to abrupt reversals, particularly if sentiment cools or profit-taking accelerates. The risk is heightened by the absence of a clear macroeconomic catalyst: silver has not reacted strongly to geopolitical events or shifts in Fed policy and instead appears to be benefiting from periods when gold consolidates or loses steam. In this context, stretched positioning without a solid fundamental anchor increases the likelihood of sharp, two-way price moves.
On the demand side, the outlook for silver remains uneven. Industrial consumption, which accounts for more than half of total demand, continues to benefit from long-term growth in electronics and solar energy. The Silver Institute expects industrial offtake to remain strong in 2025, following last year's record high of 680.5 Moz. However, momentum appears to be moderating. While demand from semiconductor and photovoltaic sectors remains firm, manufacturers in several regions remain cautious about capital expenditure, limiting near-term upside. According to the World Silver Survey 2025, total silver demand is forecast to decline slightly this year, due in part to softer jewellery and silverware demand. This suggests that while structural support from the green economy and digital infrastructure remains intact, discretionary and cyclical components of demand are showing signs of weakness.
On the supply side, production is trending higher. Global mine output is expected to grow by around 2% in 2025, with expansions underway at key operations in Latin America and North America. Scrap supply has also been rising as elevated prices and tighter physical availability prompt more recycling. Despite the ongoing supply growth, the market is still forecast to remain in deficit, with demand set to exceed supply by around 130 Moz this year. However, with production and recycling expanding faster than consumption, the scale of the deficit is gradually narrowing. This supports the view that silver’s recent price surge has been more heavily driven by speculative inflows and positioning than by any acute physical scarcity.
Q3 Outlook:
Looking ahead, current dollar softness and stabilisation in gold will likely provide further support for silver, particularly if risk sentiment deteriorates. However, with speculative positioning already elevated and mine supply expected to increase modestly, the market faces heightened two-way risks. Price action is likely to remain volatile and reactive throughout Q3, with trade likely contained between $36-$40/oz. Without a clear trigger to extend the rally, silver may consolidate, with direction increasingly driven by shifts in sentiment and positioning.
Platinum
Key Points
- Platinum holds firm above $1,400/oz fuelled primarily by speculative flows.
- Supply is recovering, but the market remains in deficit.
- Jewellery and auto demand remain firm.
Platinum enters August well supported by a growing rotation into the metal, driven in part by its relative value appeal amid a sluggish gold market. Since May, speculative appetite has grown steadily. Open interest on NYMEX is up roughly 9% YoY, with futures contracts nearing 90,700 as of 22 July. Meanwhile, ETF holdings rose by 6% into June before retreating to just under 3 Moz by late July, the lowest level so far this year. Although inflows have moderated, the earlier rotation into platinum has helped establish a firm base in the $1,350-1,500/oz range. This positioning, combined with stabilising supply conditions, points to a more range-bound but supported outlook through the remainder of the quarter.
On the supply side, conditions are gradually improving after a period of acute tightness. South African refined output is recovering following Q1 disruptions, and exports to China have accelerated, helping stabilise trade flows. Lease rates in London and Tokyo, which peaked above 20% in mid-2025, have declined back to around 11 to 12%, signalling easing strain in the physical borrowing market. Exchange stocks, which had fallen sharply earlier in the year amid tariff-related inflows, now appear to have stabilised. Though the market remains in a structural deficit projected at around 848 Koz in 2025, supply tightness shows signs of modest relief compared to earlier in the year.
Industrial and automotive demand remains mixed. Hybrid vehicle production continues to support autocatalyst use, and global automotive demand is projected to approach an eight-year high this year. In China, platinum jewellery fabrication surged roughly 26% in Q1, reflecting substitution away from gold due to elevated prices and strong consumer interest. Overall industrial and jewellery demand remain above average, though broader macroeconomic caution may temper further discretionary buying.
Q3 Outlook:
We expect platinum to remain range bound into September, supported by investment flows and a structural supply deficit. We anticipate prices to trade between $1,350 -1,500/oz. There remains room for intermittent rallies, particularly if lease rates spike again or speculative activity intensifies, but without fresh catalysts, sustained breakouts are unlikely. The market appears balanced between robust investor interest and easing supply concerns, placing price action in a phase of consolidation.
Palladium
Key Points
- Investor interest is building, with ETF holdings above 950 Koz.
- The market is heading for a 900 Koz surplus in 2025, capping upside potential.
- Demand remains weak as palladium loses ground to EV trends, despite limited hybrid support.
Palladium began Q3 with investor interest gathering pace, supported by stronger ETF demand and a visible shift in speculative sentiment. ETF holdings have climbed to more than 950 Koz, the highest level in over a year, reflecting renewed appetite for exposure to a metal that has underperformed sharply in recent quarters. Futures positioning, while still net short, has improved since May as short covering and tentative long positions began to rebuild. This reversal in sentiment has provided a firmer base for prices, which are now consolidating within a higher range.
Some of the recent strength stems from temporary tightness in the physical market. Earlier this year, dislocation between futures and physical pricing led to narrower exchange-for-physical spreads and prompted a sharp squeeze as short positions were unwound. While these pressures have since moderated, continued fund inflows and a more supportive ETF backdrop suggest that speculative flows could remain a key pillar of support. Nevertheless, with net positioning still below neutral and overall length modest by historical standards, the market remains exposed to volatility if broader risk appetite falters.
Demand fundamentals remain under pressure. Palladium’s primary use in catalytic converters for gasoline vehicles continues to face headwinds, with trade policy shifts and the global move toward electric mobility limiting upside. The reintroduction of US auto tariffs in June may slow vehicle imports and curb catalyst demand in key markets. Hybrid vehicle production offers some support, particularly in Europe where battery electric vehicle penetration remains moderate, but the broader trend is a gradual decline in palladium’s dominance within autocatalysts.
On the supply side, conditions are stable. Mine production in Russia and South Africa has normalised following earlier disruptions, and recycling volumes are holding steady. Market forecasts for 2025 point to a surplus of around 900 Koz, marking a return to oversupply after years of deficit. This expected shift in the balance adds further resistance to sustained price appreciation, unless investment inflows or fresh supply disruptions change the outlook.
Q3 Outlook:
While palladium has found a more stable footing, the market remains largely flow-driven. Short-term price direction is likely to be governed by speculative activity, not underlying demand. We expect prices to trade between $1,150-1,300/oz through September, with the risk of renewed downside if auto-related demand deteriorates or investor interest cools.

