


Our View
Global macro conditions remain highly uncertain, with the US entering a period of heightened political and economic risk. We believe that markets appear too optimistic given the potential politicisation of the Fed and the growing possibility of labour‑market weakness. Europe’s outlook remains tightly linked to US trade dynamics, particularly tariff threats, while China’s growth path is increasingly dependent on continued fiscal support amid rising external imbalances.
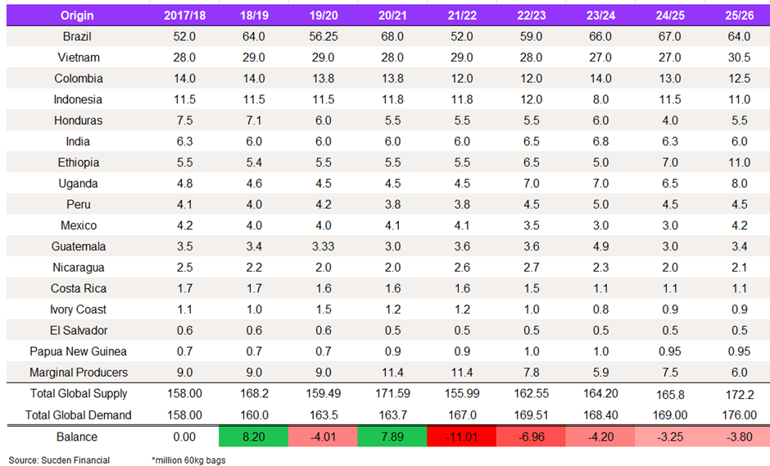
On the supply side, Brazil remains the decisive driver of global balances. The 2025/26 crop is progressing with a modest expected carry into 2026/27, while early projections for 2026/27 indicate a strong ~72.5M bag crop, though weather uncertainty remains a key risk. Other Arabica origins, such as Colombia and Ethiopia, add incremental flow but do not meaningfully alter the market’s reliance on Brazil.
Robusta conditions remain structurally tight, even as near‑term flows improve, keeping spreads firm. With Asia leading consumption growth and the 2025/26 cycle showing a small deficit, the expected Brazilian recovery in 2026/27 is poised to shift the global balance into a small surplus.
Macro Overview
US
Markets are turning their attention to the US economy, aiming to gauge the impact of the evolving geopolitical, political, and economic landscape. We believe the economy is under more pressure than markets are currently pricing in, with two key risks that could shift the narrative toward a more dovish, pessimistic stance. Namely, potential Fed politicisation and US labour market weakness sparking recession-like fears across broader markets, even if those concerns ultimately prove unfounded.
Potential Fed Politicisation
Firstly, Fed Chair Jerome Powell’s term expires in May 2026, with the nomination process likely to begin early in the year and a handover that could plausibly occur in time for the June FOMC. We expect uncertainty about the Fed’s reaction function to be reflected first in front-end rates, followed by adjustments in credit and long-dated bonds as term premia rise.
Emerging Risks Flow
With multiple factors aligning to shape a more dovish Fed perception, we expect yields to be more prone to sharp, short-lived corrections.
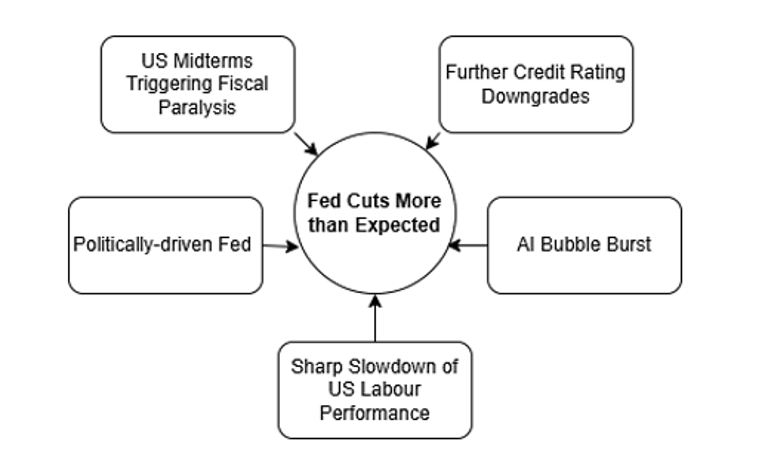
Source: Sucden Financial
Markets are closely monitoring the selection of the next Fed Chair, with Kevin Hassett currently seen as the leading candidate. His appointment could signal a move toward more growth-oriented policies, raising concerns about inflation tolerance and increasing market sensitivity to economic data. The credibility and independence of the Fed remain crucial, as any perceived threat could drive higher term premiums and greater rate volatility.
US Labour Market Outlook
Secondly, there are mounting concerns that the US labour market could weaken further in 2026, with some citing worries of unemployment rising to 6.0%. The main driver behind the slowdown is weaker hiring, a trend that began in 2025 due to high interest rates and policy uncertainty. Layoffs have remained low, indicating that the softness is more attributable to slow hiring than widespread job cuts.
Sahm Rule vs US Initial Jobless Claims
Sahm rule has been rising since summer 2025, raising the risk of labour-driven recession.
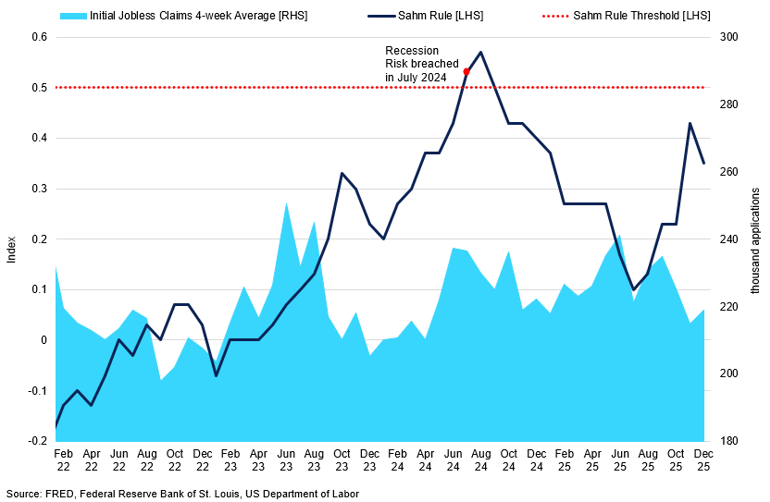
In our view, the outlook for 2026 depends on hiring trends, and there is a risk that unemployment could reach recession-signalling levels if current patterns continue. A key market focus is the Sahm rule, which signals recession if the three-month average unemployment rate rises by 0.5 percentage points above its 12-month low. As of January, the indicator is at 0.35, so there is still some cause for concern. Should the Sahm rule threshold be crossed, it could spark recession fears, market volatility, and increased demand for safe-haven assets, even in the absence of a GDP contraction.
US Outlook
These factors create an environment that could lead markets to price in a more dovish Fed in 2026, even with only a moderate number of rate cuts implemented. Importantly, what matters most is not the magnitude of Fed cuts, but rather how markets perceive the Fed’s actions throughout the year.
With multiple factors aligning to shape this perception, we expect yields to be more prone to sharp, short-lived corrections, followed by mean reversion. We continue to believe the Fed will implement only 50-75bps of cuts in 2026; the greatest risk of a dovish narrative is likely to emerge later in the year.
Europe
We believe that Europe’s outlook hinges more on its relationship with the US than on its domestic performance, whether political or economic. Indeed, Europe remains unusually exposed to threats posed by confrontational trade imbalances, including tariffs or export controls. The baseline for trade frictions with the US is already high, and it tends to recur around political deadlines and industrial policy disputes.
In January 2026, the Greenland flashpoint led to renewed tariff threats from the US, ranging from 10% to 25%. Although a subsequent deal ultimately reduced the immediate risk, we believe the US may repeat this pattern in 2026, using tariff threats as a tool of political leverage against Europe. However, given the consistent tendency for such measures to be reversed or short‑lived in practice, any new tariff action is likely to follow a similar trajectory.
Eurozone CPI vs Core CPI (%)
Eurozone’s CPI stabilised at the ECB’s target, providing policymakers with greater flexibility to cut interest rates if economic conditions deteriorate.
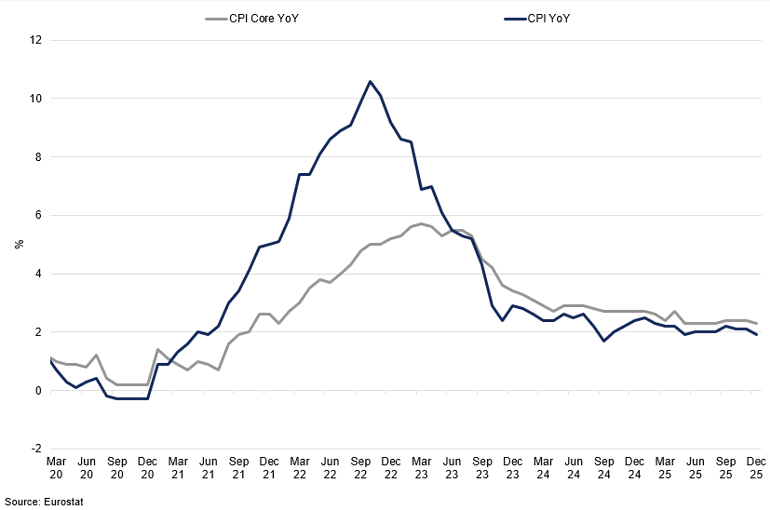
Domestically, the mood for the Eurozone’s performance has become more upbeat in recent weeks, with inflation at the ECB’s 2.0% target and labour performance still resilient, with euro area unemployment at 6.4%. However, there is a growing risk that economic performance deteriorates throughout the year, with downside becoming more prominent if exports or confidence weaken.
According to S&P Global Ratings, the euro area is expected to grow by 1.2% in 2026, down from the 1.3-1.4% seen in 2025. We anticipate Eurozone growth will moderate gradually, though downside risks would increase significantly if US tariffs were implemented and persist. However, we see sustained tariffs as unlikely.
China
In 2025, China met its “around 5%” growth target through resilient goods exports and a large fiscal impulse. Looking ahead, consensus expects growth to moderate rather than fall in 2026, but that outcome depends on the state maintaining a steady pace of support. Indeed, in 2025, China leaned on an unusually large fiscal package, including record special treasury bond issuance and expanded local-government bond quotas. From a monetary policy perspective, the PBoC eased in mid-2025 through policy rate cuts, an RRR cut, and lower benchmark lending rates. Maintaining this pace will require similar investment levels going forward.
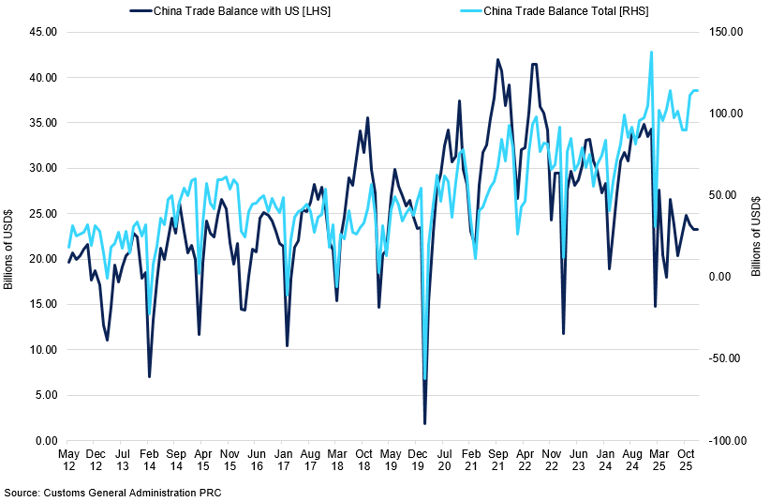
The key risk is that the growth mix becomes more imbalanced over time. China’s trade surplus reached $1tr by November, underscoring how much growth is leaning on external demand. With limited scope to counter protectionism and persistent imbalances with Europe and Mexico, exports are likely to face stronger headwinds in 2026. The US-China trade truce lasts until November 2026, but renewed trade tensions remain a material risk.
China Trade Balance with US and Global
Despite the tariff implementation in 2025 reducing trade balance with the US, China continued to grow its balance with the rest of the world.
That external drag raises the bar for domestic demand to carry more of the load. However, with limited scope for broad monetary easing, the policy burden shifts toward fiscal tools. As a result, China has pledged to broaden fiscal spending in 2026, signalling continued government support amid external headwinds. The emphasis on advanced manufacturing, tech innovation, and human capital reflects a deliberate pivot: fiscal policy is being used not just to smooth the cycle, but to steer the direction of growth.
China Coffee Consumption
China has emerged as an increasingly attractive destination for coffee exporters, driven by surging import demand and improving trade policies. In July 2025, China approved more than 180 Brazilian coffee companies for export, a move explicitly positioned as beneficial for Brazilian exporters amid growing US tariff uncertainty. This demand is further fuelled by major Chinese coffee chains, such as Luckin, which continue their rapid expansion of coffee shops and maintain deals with Brazilian farmers to support their procurement strategies until the end of the decade. Notably, the majority of China’s imports remain green coffee beans, favouring origin exporters focused on unprocessed coffee. Given that per-capita coffee consumption in China remains well below that of mature markets, we believe there is still significant room for further expansion, particularly beyond top-tier cities.
However, while China offers vast volume potential, profit margins are tighter. The market’s growth is propelled by budget and mass-market chains, which prioritise competitive pricing over high-margin specialty coffees. As a result, exporters who can provide a consistent supply, such as Brazil, are best positioned to benefit - especially as chains sign long-term agreements. Meanwhile, African exporters are likely to experience marginal gains from China’s elimination of import duties on coffee from many African countries.
Brazil
Brazilian election is less than a year away, scheduled for October 2026, but the news of Flavio Bolsonaro – the son of the now-incarcerated former president – emerged as a contender in this year’s race, adding volatility to the political picture. At first, Flavio’s candidacy seemed less competitive and even boosted Lula’s rating when he announced. But recent polls show Lula’s lead over Flavio has narrowed to 49%-45% in a head-to-head race. This presidential contest will likely be the main driver of volatility for the Brazilian real through the rest of the year.
Brazil Selic rate vs CPI YoY
Brazil Central Bank is expected to start its cutting cycle in 2026.
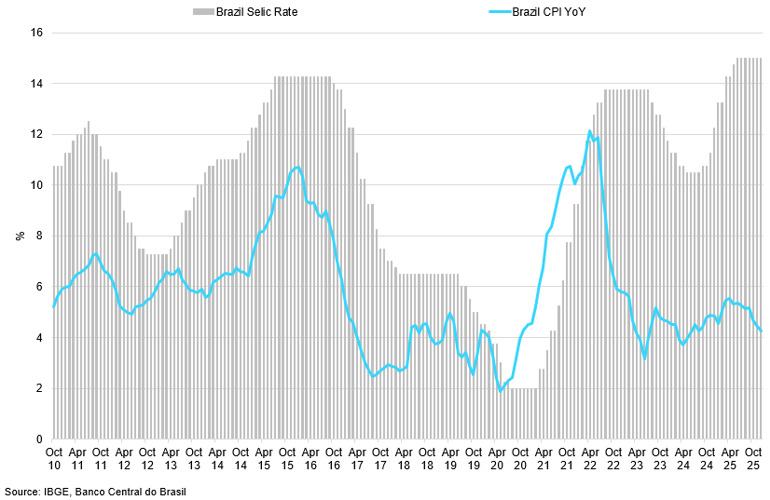
Brazil’s real has been supported by the carry trade, especially given the current BCB interest rate of 15.00%. With the BCB expected to cut rates this year, with the first cut expected in Q1 2026, and a more hawkish narrative from the Fed, the carry trade benefit is likely to unwind in the coming months, weighing on the BRL into Q2 2026.
Still, the yield differential is likely to remain in the 10-12% range in the first half of the year, meaning that BRL’s downside is likely to be quite limited, especially in the first couple of months of 2026. Should the March cut go ahead, markets are expected to reprice for a more dovish BCB, especially against a hawkish Fed, allowing USD/BRL to reach higher towards the 5.75 resistance, in our opinion.
US Tariffs on Brazil
In November, President Trump removed the extra 40% tariffs on Brazilian food products, including coffee, that had been imposed earlier in 2025. As of January 2026, the net effect for most importers is that the significant “tariff shock” on coffee in 2025 has been reversed.
Over the past week, US officials have warned of a potential 25% tariff on countries trading with Iran. Brazil is considered vulnerable because it has substantial exports to Iran and a trade surplus. This creates a meaningful risk that Brazil could face new tariff pressure in 2026, especially if the US enforces that warning broadly rather than selectively.
This history shows the administration’s willingness to target Brazil with large, politically motivated tariffs - and that it could do so again if tensions rise. In 2026, this risk remains at the forefront with either further escalation or a policy shock that shifts the current framework. Even without a full “trade war,” tariffs are now a bargaining tool for non-trade issues. As seen in 2025, this could cause short-term liquidity disruptions that are difficult to hedge. As a result, Brazil’s tariff exposure appears structural, not a one-off, and remains on our radar.
Corporate Results
Starbucks
Starbucks reported Q4 net revenues of $9.57bn. For the first time in seven quarters, global comparable-store sales turned positive (+1%): the US was flat, International +3%, and China +2% - driven by a 9% jump in transactions, offset by a 7% drop in average ticket (due to heavy discounting and mix pressure).
In late 2025, Starbucks China saw revenue growth, but weaker same-store sales and lower ticket sizes amid fierce low-cost competition. Starbucks ended Q4 with 40,990 stores after 107 net closures, including 627 tied to its restructuring. The US and China remain its core markets, with 16,864 and 8,011 stores respectively.
Starbucks seems to be stabilising demand, but it is absorbing significant costs from its “Back to Starbucks” initiatives and restructuring. Competition, especially in China, keeps promo pressure high, suggesting that while revenue may grow, profitability could remain under pressure.
Nestle
Nestlé reported CHF 65.9bn in sales and 3.3% organic growth, with momentum picking up in Q3 to 4.3%. Coffee was one of the biggest growth drivers, and Nestlé called coffee demand “resilient.” Nespresso led the way, with CHF 4.7bn in sales and 6.7% organic growth.
Nestlé is relying on coffee as a steady growth and pricing engine, while working to boost volumes through investment and sharper execution. Should coffee demand stay “elasticity-resilient”, it can keep funding brand investment and help steady group growth. The key variables are commodity costs and how much pricing can rise before volume slips.
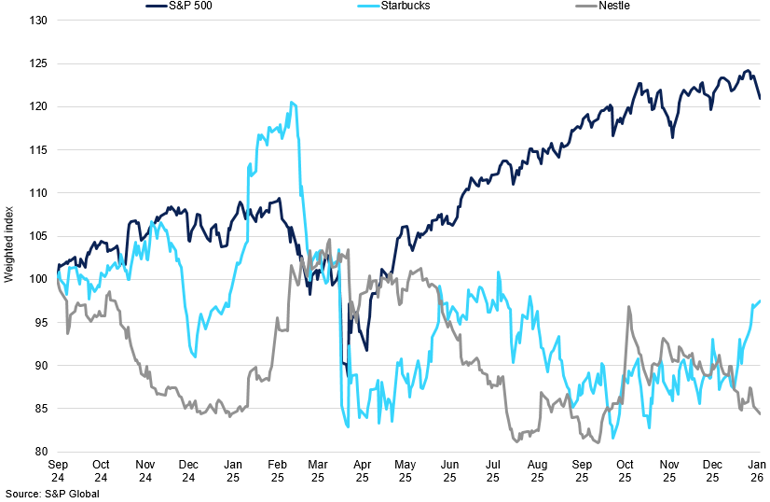
Normalised S&P vs Nestle vs Starbucks Relative Performance
Luckin
Luckin’s latest numbers show the business expanding rapidly. In Q3 2025, Luckin posted net revenues of RMB 15.3 billion, up 50.2% YoY, and finished the quarter with 29,214 stores, adding 3,008 net new locations. Usage also kept climbing, with average monthly transacting customers hitting 112.3 million.
Overall, Luckin is aiming to turn coffee into a high-frequency, mass-market product in China: more stores and growing traffic show it is expanding, even in a competitive, price-sensitive market. To support this scale, the company is locking in long-term supply, recently announcing plans to buy 240,000 tonnes of Brazilian coffee over 2025–2029 as a signal of confidence in continued volume growth.
Supply
Brazil
The 2025/26 Brazilian crop begins with a relatively tight but manageable domestic balance. Over the first six months of the crop year (July–December), exports are estimated at ~20.9M bags, while domestic consumption is assessed near 10.5M bags, taking total offtake to ~31.4M bags. This compares with 26.0M bags of exports over the same period in 2024/25, reflecting a more measured pace of shipments in the current cycle.
Our working production estimate for 2025/26 remains unchanged at 64M bags, comprising 39M Arabica and 25M Robusta (Conillon). Assuming January–June exports around 21M bags and domestic consumption again near 10.5M bags, full-year offtake would total ~63M bags, leaving a modest carry of ~1M bags into 2026/27. While not large, such a carry helps stabilise the balance sheet at a time when global Arabica availability remains sensitive to weather and logistics. Should the projection hold through August/September, Brazil would transition the global balance into a small surplus, tempering the deficit dynamics observed through 2025.
Farmer selling behaviour is unchanged. Brazilian growers continue to sell only into rallies against the ‘C’ contract, prioritising domestic currency returns. Internal physical prices remain firm, as conillon remains relatively expensive a premium FOB over Robusta futures.
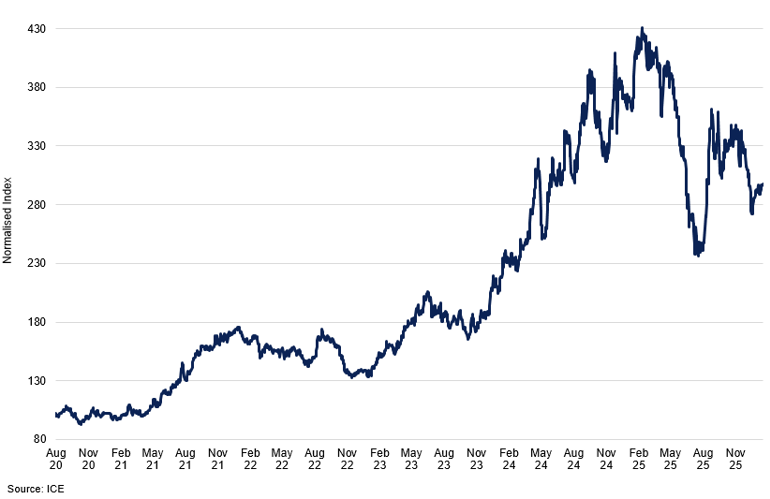
Normalised Arabica Price
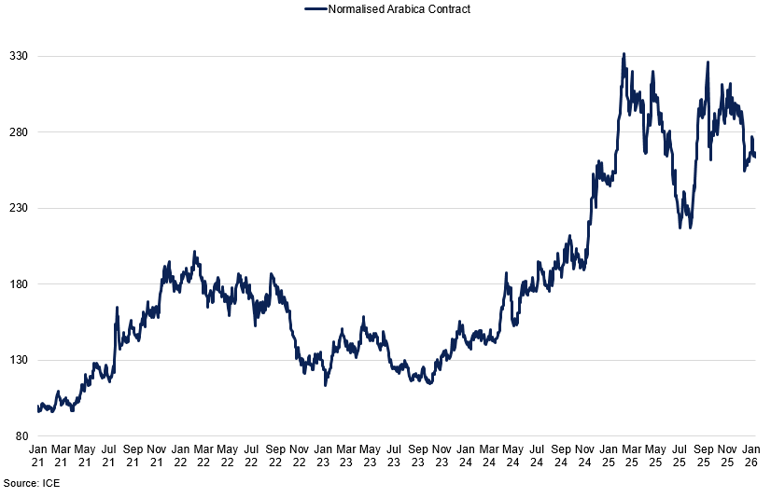
Our initial projections for the 2026/27 crop point to ~72.5M bags, with 47.5M Arabica and 25M Robusta. Weather is once again the determining variable. While rainfall has improved overall, pockets of Sul de Minas and Zona da Mata have received less-than-ideal moisture, and recent episodes of elevated temperatures warrant monitoring.
Attention is turning to 2027/28 as a likely off-cycle for Arabica, but the traditional biennial pattern seen two decades ago is no longer a reliable guide. The adoption of higher-yield hybrid varieties and better agronomic practices has muted pure cyclicality, shifting the emphasis toward weather outcomes. For trees to deliver consistently high yields, stable conditions are required across flowering, fruit set, and development, yet weather in recent years has become increasingly erratic. As a result, the primary risk to the 2027/28 crop is not the calendar cycle itself but the persistence of unpredictable weather.
Other Arabica Origins
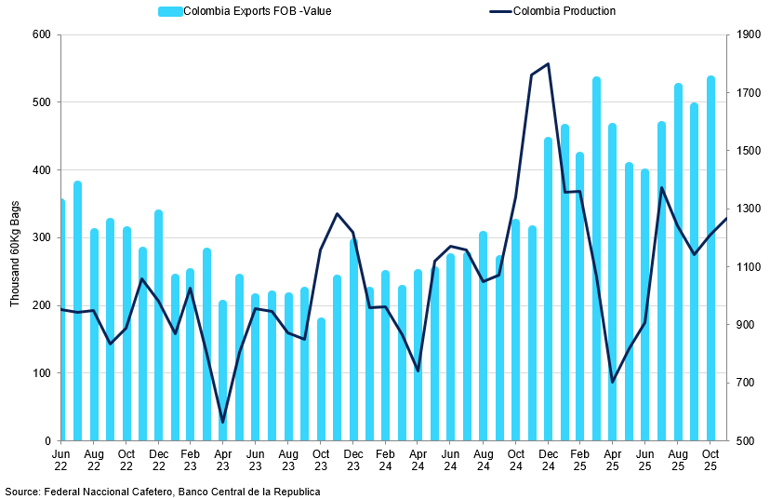
Colombia has been a steady contributor to global Arabica availability. December exports are slightly below last year but still above the 1M bag/month threshold, and 12-month rolling exports (Dec 2024–Nov 2025) are broadly consistent with a good crop. Domestic consumption is likely at least 2.0M bags, and possibly closer to 2.5–3.0M, leaving limited room for continued high export volumes.
Following difficulties in 2022/23, Colombia imported ~1.9M bags from Brazil, and more recent imports of ~900K bags indicate that imported coffee has helped sustain export volumes. One factor influencing these trade flows in 2025 was the shifting US tariff regime on coffee imports. Earlier in 2025, the US introduced a 10 % baseline tariff on most coffee imports as part of a broader trade initiative, but Brazilian coffee was subject to a much higher 40% duty. This made Brazilian coffee relatively more expensive into the US, encouraging exporters to redirect volumes to other markets such as Colombia while US buyers adjusted sourcing. Later in the year, many of these tariffs were rolled back or exempted for staple agricultural products, including green coffee from most origins, easing import costs again.
Most domestic stocks appear to have been drawn down, and with the current crop experiencing some rain-related quality issues, it would not be surprising if export volumes moderate as the year progresses.
Colombia Exports vs Colombia Production
Trade flows have revealed unusual inter-producer movements: Brazil shipped coffee into Colombia; Indonesia shipped into Vietnam and is believed to have also moved coffee into China. Rather than signalling surplus availability, these movements reflect pricing incentives, where high flat prices and firm differentials make it more economical for exporters to source coffee from other producers.
Ethiopia continues to surprise with 12-month exports of ~7.3M bags, and there is now discussion that production could be closer to ~11M bags, though reliable data remain limited and long-standing statistical uncertainties make verification difficult.
Taken collectively, the Other Arabica complex contributes incrementally to global supply but does not alter the reliance on Brazil as the arbiter of global balance.
Robusta
Robusta remains structurally tight into early 2026, although near-term flow has improved. Vietnam is estimated to have sold ~10M bags of new crop, a reasonable figure given a crop of ~29M bags and domestic consumption of ~3M bags, leaving roughly ~16M bags for export over the next seven months.
This equates to ~2M bags/month, a meaningful volume, though farmers may choose to pace sales more conservatively to retain stocks in a manner similar to Brazil. Indonesia maintains firm differentials, and Brazilian Conillon continues to price at a premium relative to Robusta futures.
Normalised Robusta Price
The regional flow picture is constructive. Vietnam exported ~3M bags in December, while Brazil is expected to report a similar figure. Central America continues to contribute modest Arabica-replacement volumes, and Colombian shipments remain steady. Combined, these flows create a temporary buffer for the industry through the next 2–3 months, reducing immediate scarcity but not resolving medium-term tightness.
Spread behaviour corroborates the tight structure: the Robusta nearby spread is a premium, and certified stocks are continuing to moderate week-on-week. Tight Robusta availability remains a key sensitivity for the broader complex, particularly if Arabica’s 2026/27 Brazilian recovery is delayed or revised lower.
Consumption
Despite a more bearish tone in recent weeks, it is worth remembering that coffee continues to be consumed at scale. Demand remains resilient and large roasters report limited consumer resistance despite elevated retail prices. While recent tariff adjustments may have weighed on US consumption, European demand appears relatively stable, with Germany overtaking the US in 2025 as Brazil’s largest export destination.
Further east, demand growth becomes more pronounced. Asia remains the fastest-expanding segment of global consumption, with China now among Brazil’s top ten coffee importers at ~1.1M bags in 2025. The Middle East is also emerging as an important demand centre, with rapid growth in café networks and household consumption.
Producer behaviour adds another layer of interest. Mexico imported ~920K bags from Brazil in 2025, Colombia ~840K bags, and Vietnam ~350K bags. Such flows enable smaller producers to meet export demand for their own grades while supplementing domestic blends with Brazilian coffee, reinforcing Brazil’s role as the liquidity provider of the global coffee system.
Soluble production capacity in key importing countries continues to support structural demand for Robusta, contributing to persistent tightness. Elevated 12-month exports suggest stocks are not rebuilding, and price levels remain a deterrent to extending forward cover. We believe that many roasters may only feel comfortable lengthening commitments if values settle closer to ~260 c/lb.
Inventories
Coffee Inventory Levels per Location
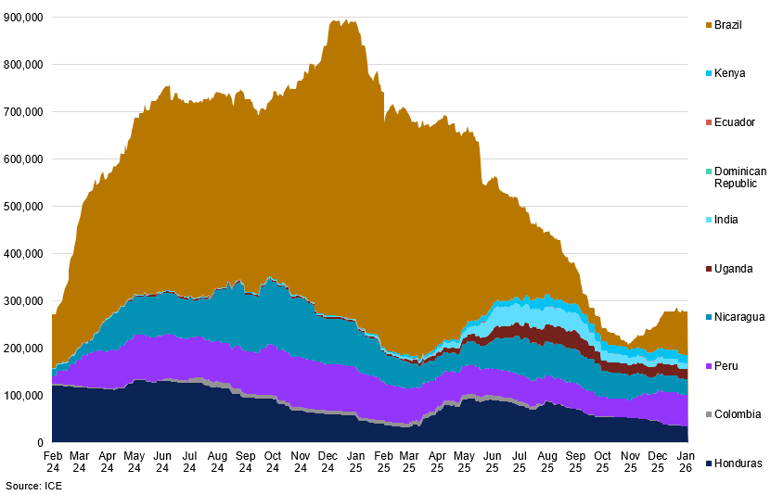
Under a 176M bag demand assumption, the 2025/26 cycle amounts to a ~3.2 M bag deficit, covered through draws on origin and roaster inventories. Brazil’s 2026/27 crop is expected to improve the balance sheet. A projected 72.5 M bags (including 47.5 M Arabica) adds roughly 8.5 M bags relative to 2025/26, shifting the global balance to a ~4.7–5.3 M bag surplus, assuming stable weather and adequate Robusta availability.
COT
Arabica Managed Money
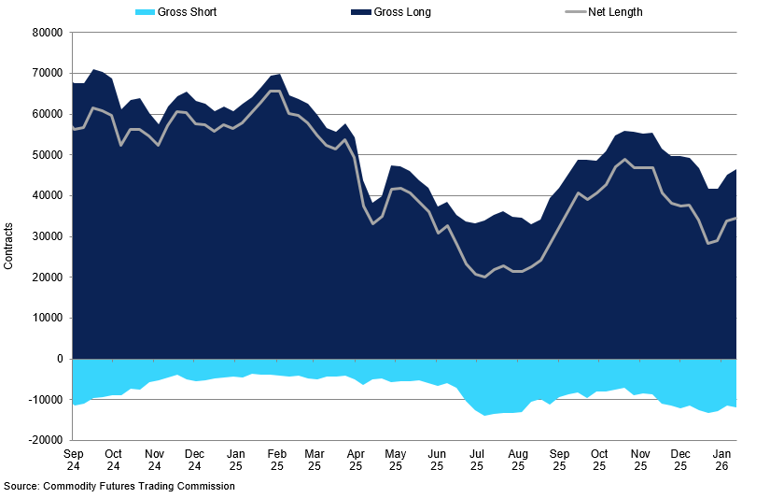
Bearish sentiment has gained traction as we move through the second half of January. As of 13 January, managed money held a net long of 34,545 contracts in Arabica, more than 20,000 contracts lower than at the same point last year. While net length has recovered modestly from late-December levels, positioning remains consistent with expectations of more comfortable supply ahead.
Since November, gross long positions have remained below 50,000 contracts, while gross shorts have increased and consistently held above 10,000 contracts. As of 13 January, gross longs stood at 46,398 contracts and shorts at 11,853. The build in short exposure reflects growing confidence that supply will normalise through mid-2026, even as current fundamentals remain broadly stable.
There is, however, an additional layer of positioning risk. The market remains alert to the possibility of cross-commodity liquidation following the sharp correction in cocoa. Should funds reduce exposure across the softs complex, coffee could be pulled lower irrespective of its underlying fundamentals.
Arabica Commercials
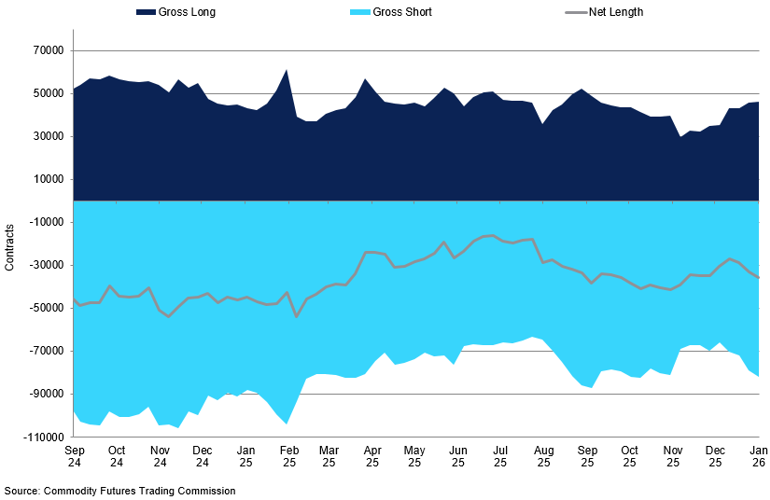
From the commercial perspective, positioning suggests a more balanced market than a year ago. As of 13 January, commercial participants held 46,154 gross longs and 82,011 gross shorts, resulting in a net short of ~35,857 contracts. This is markedly smaller than last year’s wide net short, when commercial hedging volumes exceeded the equivalent of the Brazilian Arabica crop. The reduction in net short exposure implies less aggressive forward hedging and reflects expectations of improved supply through 2026, particularly from Brazil and Vietnam.
The narrowing of the commercial short also eases concerns around physical availability. While the market remains structurally tight in Robusta due to soluble demand and limited certified stocks, Arabica appears more balanced, and roasters face less acute competition for unhedged physical coffee than at the peak of the tightness cycle. At the same time, the relatively modest commercial long position suggests roasters are not inclined to extend cover far forward at current flat prices, preferring to wait for more attractive levels or greater clarity into the 2026/27 Brazilian crop. In this environment, the forward structure remains sensitive to weather and sentiment, but the hedge book is no longer signalling the same degree of scarcity that drove markets higher in 2024–25.