


Our View
The coffee market enters mid-year in a tighter position than recent price action suggests. The sharp rally earlier in 2025 was fuelled by roasters caught short, prompting urgent buying that propelled futures above $4. However, the scale of the move was driven less by structural tightness and more by a widespread underestimation of Brazil’s crop. Our January outlook anticipated stronger supply than broader market consensus, and recent export data has since confirmed that view. This reinforces our conviction that prices above $4 are not sustainable under current fundamentals. Once immediate needs were covered, commercial demand faded and prices became increasingly supported by speculative length, creating an imbalance that ultimately led to liquidation. The correction has cooled momentum, but the underlying risks remain.
We hold a tactically neutral stance, though the bias leans to the upside. The market is structurally tight: consumption is holding up despite elevated retail prices, differentials remain relatively firm across key origins, and certified stocks continue to decline. Brazil and Vietnam remain the key pillars of global supply, but with Vietnam largely sold out and Brazil behind its typical forward sales pace, any disruption, particularly weather-related, could trigger a sharp rally.
Brazil will be the key swing factor in the coming weeks. Producers appear in no rush to commit to forward sales, and given recent volatility, buyers face genuine counterparty risk. The days of booking multi-month cover and expecting it to hold have faded; renegotiation is increasingly common if market prices rise. In this environment, purchasing strategies must be more selective, and more flexible.
Conillon flow should begin to improve from June onwards, with Arabica movement expected to pick up in July. From there, attention will shift to Q4 and the arrival of new crop from Vietnam and Central America. In the absence of any significant weather event, we expect rangebound trading to persist through this transition period, with no clear catalyst to break the current equilibrium. The market lacks clear directional conviction for now, but remains highly sensitive to weather, and we would turn more decisively bullish should any adverse developments materialise.
Macro Overview
US
The US economy enters June under growing scrutiny as investors reassess the country's role in the global financial system under President Trump. The current administration's disorganisation in implementing tariffs has introduced a deep layer of uncertainty in the markets, culminating in a global market shock on the April 2nd "Liberation Day". Although a 90-day pause was introduced immediately after the reciprocal tariff announcement, the ensuing panic led investors to lower their economic growth forecasts for both major and emerging markets. This shift has also resulted in widespread recession fears, particularly those associated with the US, whose assets experienced a significant sell-off in April.
While trade deals with the UK and a subsequent reduction in tariff rates with China alleviated some concerns about supply chain disruptions, a new concern has emerged that is dampening the US economic outlook. Trump's tariff disruptions, alongside his plea for tax cuts, have created major uncertainty regarding the nation's fiscal outlook, prompting Moody's to downgrade US debt rating from Aaa to Aa1. Although the economy continues to show signs of robustness and remains healthy, months of ongoing trade uncertainty, fears of tariff re-escalation, and a deteriorating long-term fiscal outlook for the US under Trump have eroded market confidence.
ISM Manufacturing PMI vs Import Index
After tariffs were introduced in April, the import gauge fell to its lowest level in 16 years. 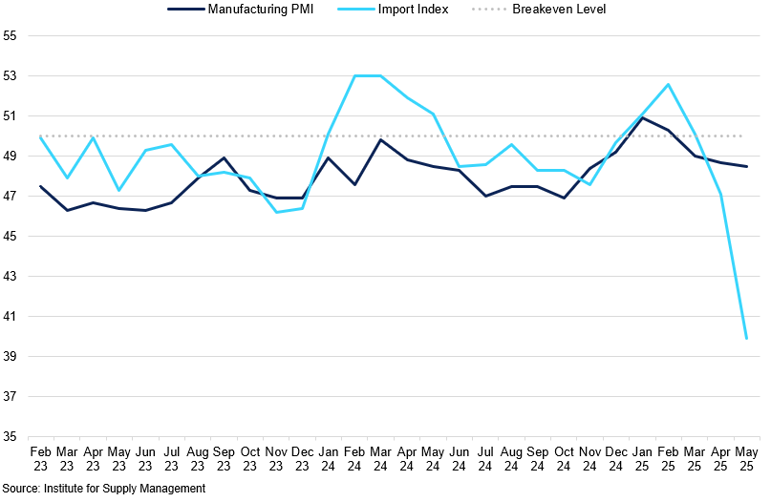
All of this suggests that the US dollar has come under significant pressure, falling back below the 100 mark once again in late May, underscoring a growing loss of confidence in the broader narrative of US global influence. While the US economy appears to be in good shape from an economic standpoint, we anticipate that political factors will weigh heavily on the US economy in the long term, which may keep the dollar's performance subdued. We believe a fair value for the US dollar is around the 101-102 range, and a significant break above these levels could be challenging, even with further trade agreements.
Against this backdrop, the Federal Reserve finds itself in a precarious position, managing the easing inflation pressures that are expected to rebound due to tariffs alongside persistent fiscal and political uncertainty. We expect the upcoming inflation re-acceleration to be more gradual than markets may anticipate. This is due to the continued front-loading that is helping to build inventory stockpiles in the US, particularly through July 8th, which should provide a temporary buffer against inflation pressures.
University of Michigan Sentiment and 1-year Ahead Inflation Expectations
After the implementation of tariffs, inflation expectations surged as overall sentiment worsened. 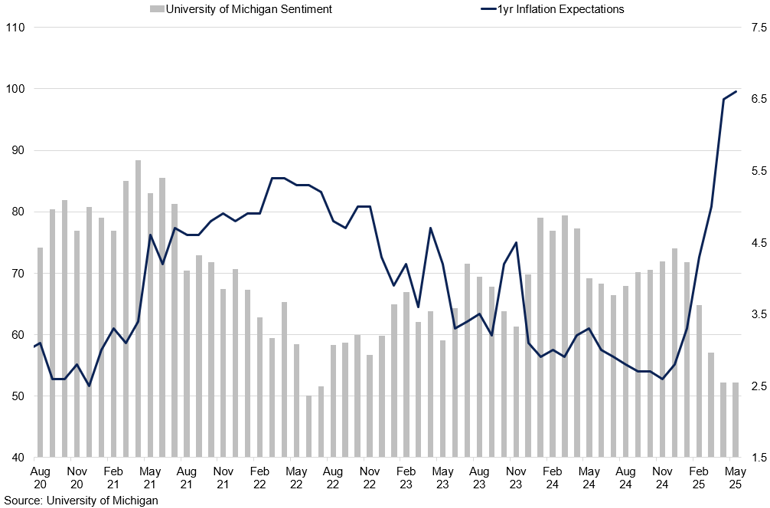
While we view it as unlikely, if high tariffs are reintroduced, we do not expect exporters to halt shipments to the US market entirely. Domestic demand remains healthy, so it is more probable that importers will initially absorb the price increases before passing them on to consumers. Initially, the prices may be increased only partially, reflecting the uncertainty surrounding the full tariff rate. By the second half of 2025, the majority of these costs will likely be passed on to consumers, with an estimated 80-90% of all tariff-related expected to be transferred, based on patterns observed during the previous round of Trump-era tariffs. Inflation is expected to rise gradually as the compounding effects become more pronounced with the full implementation of tariffs.
What this means is that the Federal Reserve is better off maintaining elevated interest rates for as long as possible. The markets are beginning to reflect this belief, with 50bps of rate cuts anticipated by the end of the year, although the next cut is not expected until mid-September. This approach should allow the central bank to assess the situation more clearly and understand the long-term effects on consumers and households rather than responding to short-term fluctuations caused by tariff changes.
Europe
What began as a transatlantic trade disagreement is fast becoming a defining test of European resolve. As the US escalated its tariff threats, the Eurozone was not just merely reacting; it was repositioning. In response to Trump's most recent tariff re-escalation, initially set at 50%, the bloc introduced a retaliatory package worth €100bn, targeting key US exports, including Boeing aircraft and agricultural goods.
The current extension creates a strong precedent for both nations to reach an agreement by early July. We believe that some form of a deal should be finalised by then. We also believe that the Trump administration's back-and-forth tariff moves are intended to speed up negotiations ahead of the deadline, aiming to avoid issuing further threats, as their leverage looks to be diminishing.
The Eurozone's relatively strong political position is bolstering its strength, reflected by the continued appreciation of the euro against the dollar. Additionally, the Eurozone's current account surplus reached a nine-month high in March, supporting the euro's rise. As a result, global investors are increasingly looking for alternatives to US dollar assets.
Europe’s CPI vs Core CPI YoY
Key inflation metrics are nearing 2%, the ECB’s main guide for managing pricing pressures through monetary policy. 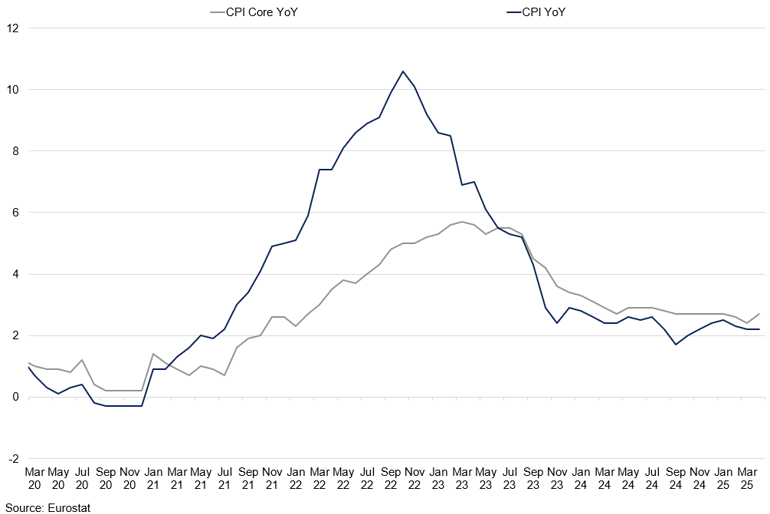
Despite expectations of continued trade tensions with the US, the Eurozone economy showed a stronger-than-expected performance in Q1 2025, with GDP expanding by 0.4% QoQ. This marked the fifth consecutive quarter of growth, partially driven by increased exports to the US, as European firms raced to meet tariff deadlines. Yet this momentum may not be sustainable. With domestic demand still lacklustre, the coming quarters could see renewed pressure on both industrial output and consumer confidence.
In the weeks ahead, the Eurozone's economic direction will be shaped not just by macroeconomic fundamentals but by the outcome of a high-stakes diplomatic balancing act. If trade negotiations with the US collapse, the activation of Brussels' €100 billion retaliatory tariff package could chill growth and unsettle markets. If diplomacy prevails, however, some of the current pressures may ease, offering a reprieve to exporters and investors alike. For now, the EU's coordinated stance offers a measure of stability, buying time as it navigates both external pressure and internal economic fragility.
China
Amid heightened scrutiny of US trade ties, relations with China have emerged as a distinct focal point. Following "Liberation Day," the US and China have both eased their respective tariff rates towards each other. However, the current rates are still above those seen before 2025. Specifically, the US has reduced its tariffs on Chinese goods from 145% to 30%, while China has lowered its tariffs from 125% to 10% during the 90-day period. This means that although the need to reroute goods around China is no longer necessary, the price increases are likely to impact US consumers.
Despite tensions re-escalating recently, we anticipate that the trade deal between the two nations is unlikely to collapse by the end of the 90-day period. China has demonstrated a strong stance against the initial round of US tariffs by encouraging domestic consumption, lowering interest rates, and allowing its currency to devalue. This indicates that China will not back down on its demands, creating a stronger precedence for the Trump administration to compromise. While tensions between the two countries may increase as the deadline approaches, the uncertainty and resulting volatility are expected to be less severe than during "Liberation Day".
China’s Economic Indicators
Economic indicators suggest that domestic demand in China continues to be lacklustre. 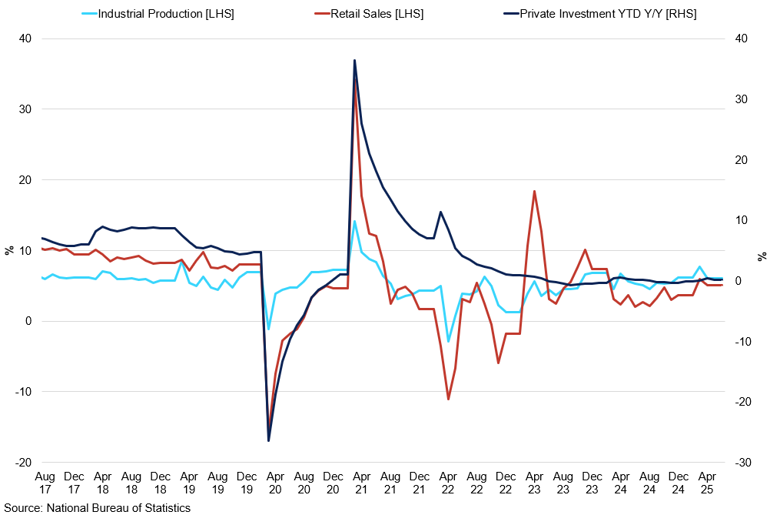
This trade reprieve comes at a sensitive time for China's economy, with growth slowing under the strain of subdued global demand. China's Q1 2025 GDP growth reached 5.4%. While this is a positive sign, it also reveals a worrying trend: nearly 40% of that expansion came from net exports, as the nation front-loaded on its exports to the US ahead of the tariffs. This reliance on foreign demand exposes the economy to sharper risks if US-China trade tensions re-escalate.
Meanwhile, domestic indicators remain weak. Land sales fell another 16% in Q1, extending the three-year decline. Despite promises to boost domestic demand and shield the economy from external shocks, infrastructure spending under the general public budget dropped by 4.2% YoY, marking the first decline in two years. Investment in key sectors like urban development, water conservation, and transportation remains sluggish.
As we look towards the rest of Q2, China's trajectory will hinge on two fronts: the effectiveness of its domestic stimulus measures and the durability of the newly brokered trade truce. If talks falter or the tariff rollback proves short-lived, downside risks could quickly resurface. For now, however, Beijing appears focused on consolidating internal stability while allowing time to test whether American policy will evolve from disruption to dialogue.
Brazil
As global markets focus on trade tensions with the US, Brazil's relative exemption from higher tariffs shifts attention to its domestic performance, which remains the key driver of the Brazilian real. Given Lula's big spending plan to support the economy since 2023, the domestic performance results have been better than expected. Brazil has expanded further in Q1 2025, growing by 1.4% vs 0.1% QoQ in Q4 2024. At the same time, the government lifted its GDP forecasts for 2025 up to 2.4%, up from 2.3% seen in March, given higher agricultural production as well as the continued support of robust consumer spending.
However, this comes at a high cost of inflation, which remained elevated at 5.40% in May, the highest level in roughly two years. Food and beverages drove price increases, climbing 1.17% in the month alone. At the same time, the expectations of inflation continue to increase, with end-of-year projections growing from 4.9% to 5.0%.
Federal Funds Rate vs Brazil Selic Rate
The positive rate differential between the BCB and the Fed continues to support favourable conditions for the carry trade.
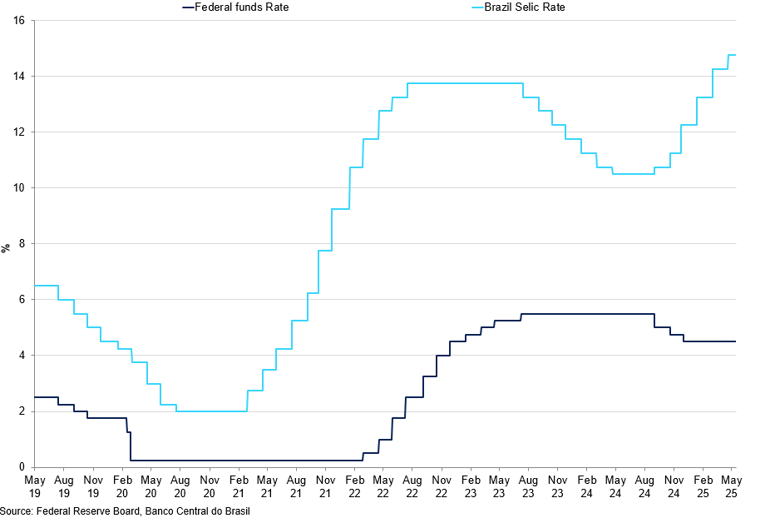
The Brazilian real was rocked by the "Liberation Day", where a universal 10% tariff was introduced on all Brazilian exports. Despite this, the carry trade remains attractive since Brazil is relatively insulated from these changes and could emerge as a winner. Additionally, higher local interest rates enhance the appeal of the real for carry traders.
On May 7th, the Brazilian central bank raised the Selic rate to 14.75%, marking the highest level in two decades. They have also indicated the possibility of either pausing the rate hikes or implementing a further increase of 25 basis points. Although the Brazilian Central Bank (BCB) has left room for more rate hikes, the rates are nearing their natural peak. A pause followed by a possible hike seems to be the most sensible approach, allowing time to assess the immediate effects of the tariffs before factoring in inflation.
Corporate Results
Starbucks
Starbucks reported mixed results for its fiscal Q2 2025, reflecting both regional strengths and ongoing challenges. Global comparable store sales declined 1% for the 13-week period ending March 30th, as softer traffic in North America weighed on performance. In North America, a 4% drop in transactions was partially offset by a 3% increase in average ticket size, resulting in a 1% decline in comparable sales. However, with US same-store sales down 2% and competition intensifying, particularly in China, investors are watching closely to see if these strategic efforts will translate into sustained growth.
International operations fared better, with a 2% increase in comparable sales, supported by 3% transaction growth, though average ticket size dipped 1%. China remained flat overall, balancing a 4% rise in transactions with a 4% fall in ticket size.
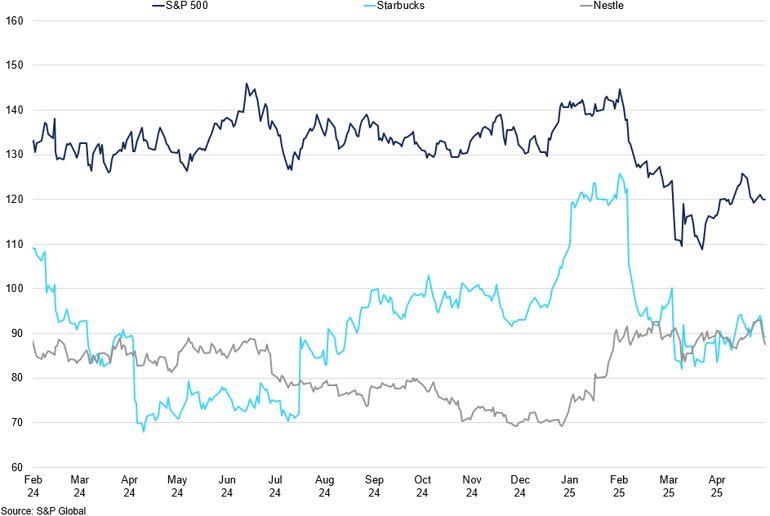
Starbucks vs Nestle vs S&P 500 Performance
US stocks, including Starbucks and Nestle, sold off following “Liberation Day” in early April.
Nestle
Nestle delivered broad-based organic growth of 2.8% in Q1 2025, surpassing expectations of 2.5%. This was primarily driven by a 2.1% increase in pricing to offset rising input costs, particularly in coffee and cocoa, while RIG contributed 0.7%. Zone AOA led regional performance at 3.1%, followed by Europe at 2.4% and the Americas at 1.9%.
Nespresso saw strong momentum with 5.7% growth, largely supported by 3.2% in pricing, while confectionery led all categories with 8.9% growth, driven by a 10.1% increase in prices. These pricing actions were primarily in response to input cost inflation, particularly in coffee and cocoa. Looking ahead, Nestle expects organic sales growth to improve compared to 2024, aiming for a trading operating profit margin of at least 16%.
Supply
Brazil
Brazil remains the cornerstone of global coffee supply. Since the start of the year, confidence in the current crop has improved. Back in January, much of the market was working with a 2024/25 production estimate of around 64m bags. We projected 67m at the time and continue to hold that view - now more widely accepted as export data has confirmed stronger availability.
Looking ahead, we forecast a 2025/26 crop of 63m bags (comprising 39m Arabica and 24m Conillon), representing a 4m bag decline YoY, largely due to weather-related factors. Despite the projected decline in 2025/26 output, the overall supply picture is more comfortable than it appeared six months ago, largely due to stronger-than-expected performance in the 2024/25 cycle. This upward revision has eased some of the pressure on the forward balance sheet and improved short-term confidence.
Brazil Coffee Local Price vs 2nd Month Arabica
Local Brazilian prices have remained elevated despite recent softness in ICE futures.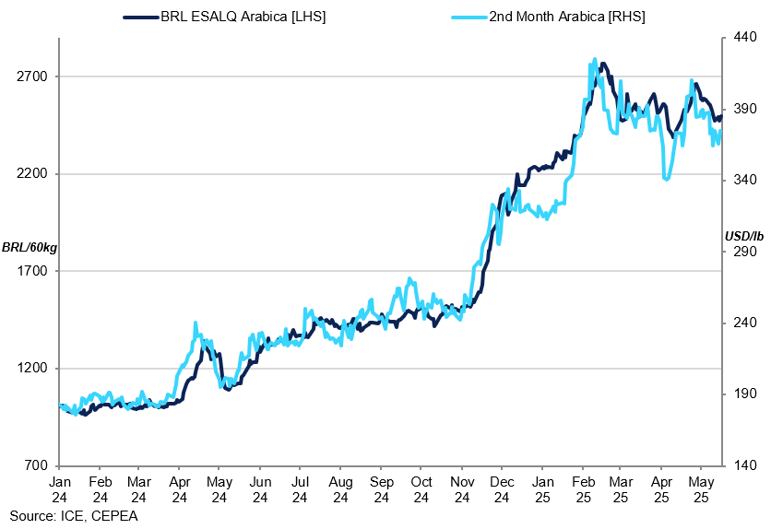
That said, Brazil’s internal consumption—estimated at around 21 million bags—continues to absorb a large portion of production. This implies an exportable surplus of roughly 42 million bags over the next 12 months, compared with 47.883 million exported between May 2024 and April 2025. As a result, even with improved near-term supply, export availability may tighten somewhat in the months ahead.
Brazil Exports MoM
Brazilian coffee exports have eased recently, though levels remain historically strong.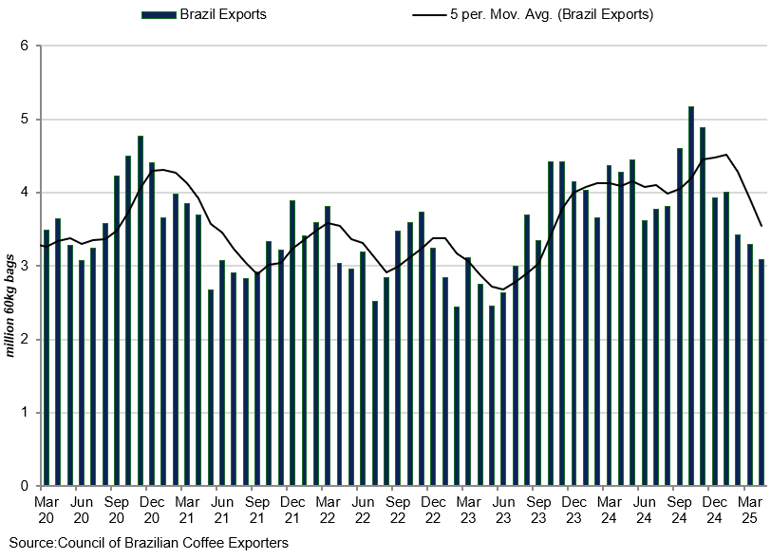
In years with favourable weather conditions, such as 2020, Brazil’s output has exceeded 80m bags, underscoring the ongoing sensitivity of supply forecasts to climatic variability. For now, the upward shift in supply expectations has helped stabilise market sentiment, reinforcing the view that while supply remains finely balanced, it could prove sufficient to meet demand, provided no major weather disruptions occur in the months ahead.
Vietnam
Vietnam is nearing the end of its 2024/25 cycle, with around 90% of the crop sold. Our estimate remains at 27m bags, rising to 29m for 2025/26 (October to September). With the new crop still five months away and little coffee left at origin, selling pressure from Vietnam is expected to remain limited until Q4 2025.
Vietnam continues to play a crucial role in global Robusta supply and, along with Brazil, is estimated to account for 53–54% of global demand.
Vietnam Exports vs Local Robusta Prices
Export volumes have remained constrained despite historically high local prices.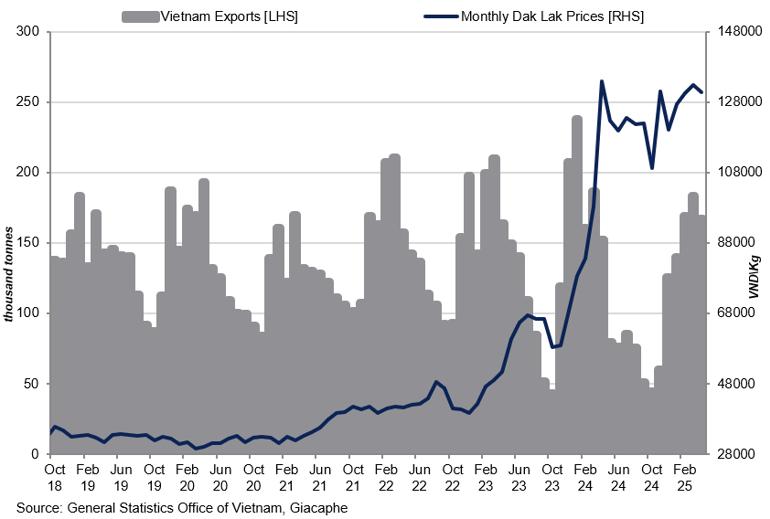
Colombia
Colombian supply has improved. According to ICO data, exports of Colombian milds reached 7.183m bags between October 2024 and March 2025, up from 6.688m in the same period a year earlier. Over the 12 months to March 2025, total exports rose to 12.985m bags, indicating stronger availability and a more consistent export flow. Although most early-season coffee has already been sold, there are signs that the mid-crop may come under pressure, with uneven weather conditions potentially affecting flows.
Colombia Exports vs Colombia Production
Colombian export have surged this year.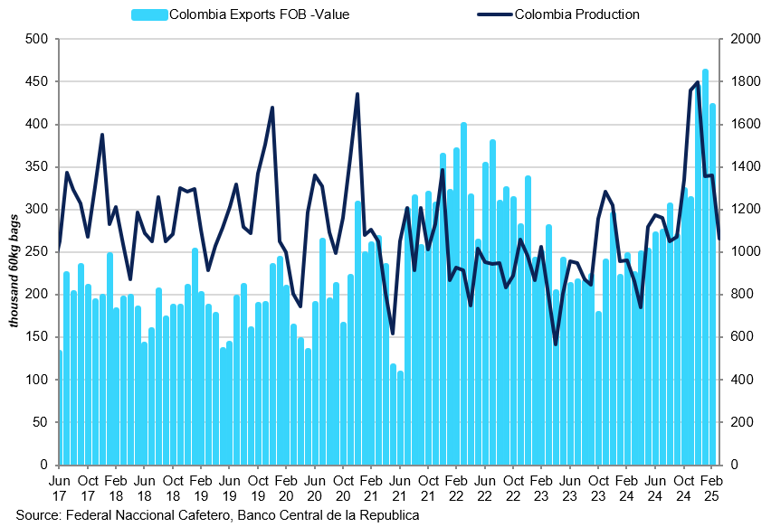
Central America
Shipments from Central America have been mixed, but most of the region’s coffee is now reported to be sold. Higher prices earlier in the year encouraged origin selling, but many trade buyers were constrained by limited capital and heightened counterparty risk, reluctant to take on forward exposure amid market volatility. As a result, volumes were placed selectively, and only well-positioned traders were able to secure coffee when differentials temporarily narrowed. With the current crop largely committed, activity has slowed. Attention is now shifting to the upcoming 2025/26 harvest, which we expect to improve YoY. We project Honduras to reach close to 5.5m bags, supporting a more constructive regional supply outlook.
Consumption
Industry feedback suggests that coffee consumption has remained resilient despite elevated prices, but the impact of higher costs is expected to become more visible at the consumer level over the next three months. Demand in price-sensitive markets such as the US and Europe may begin to soften as households adjust spending in response to rising coffee prices and broader inflationary pressure. The recent introduction of US import tariffs has added to this strain, increasing costs for importers and disproportionately affecting specialty retailers and smaller businesses.
Global shipments over the past 12 months have remained strong, yet certified Arabica and Robusta stocks have not shown any meaningful increase. This suggests that coffee is being absorbed by the market rather than accumulating in inventory, reinforcing the view that global consumption remains solid - potentially around 169m bags. While retail prices continue to trend higher and discretionary demand for premium or differentiated coffees may begin to soften, there is still little evidence of significant demand destruction at this stage.
With the arbitrage between Arabica and Robusta still wide at around 140 cents (compared to a more typical range of 25–40), consumption dynamics and substitution patterns will remain key factors to watch. Overall, consumption trends continue to be a critical component in assessing demand-side support through the second half of the year.
Inventories
Certified coffee stocks have continued to trend lower in recent months, standing at 892,468 bags as of late May, down from 985,672 at the start of 2025. While some replenishment may occur in the months ahead, the potential for a meaningful rebuild remains limited. Earlier in the year, expectations had pointed to certified inventories reaching as high as 2 million bags, but current levels remain far below that mark. Drawdowns continue in Brazilian coffee, with no new volumes currently entering the grading process, further constraining the pace of replenishment. In Robusta, grading activity has slowed, primarily due to restricted access to financing rather than deliberate stock withholding. As a result, there is little room for a near-term recovery.
The continued backwardation in both markets is not encouraging for the certification of coffee, with many preferring to operate on a back-to-back basis. Generally, the cost of holding stock is already elevated, and the additional costs associated with certified stock make it even less appealing. While grading under the C contract is still ongoing, the broader outlook for certified stock growth appears capped in the current environment.
Coffee inventory levels per location
Certified coffee stocks have declined in recent months.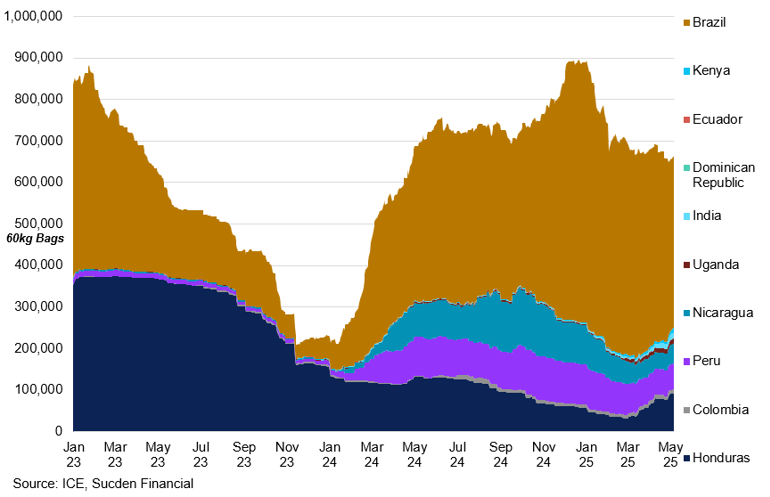
Brazil remains at the heart of these concerns. High futures prices earlier this year incentivised aggressive selling from origin, which helped alleviate short-term availability pressures. However, Brazil’s capacity to rebuild working stocks remains constrained by lingering crop disruptions. The upcoming 2025/26 harvest is forecast at around 63m bags, which is modestly below previous years and limits the country’s ability to restore stocks. Years of adverse weather, most notably the severe frost of 2021, have contributed to a structural decline in Brazil’s carryover inventory. With diminished stocks and ongoing supply uncertainty, the market remains acutely vulnerable to future disruptions. This reinforces the importance of closely monitoring certified inventory levels in the months ahead.
COT
Speculative participation in the Arabica coffee market has declined in recent months, reflecting growing caution amid macroeconomic headwinds and uncertainty around supply fundamentals. As of 27 May 2025, managed money funds held a net long position of 23,577 contracts, down from 40,093 contracts at the end of 2024. This reduction in net length indicates a softening of bullish conviction among non-commercial participants, many of whom appear to have taken profits or exited positions amid reduced momentum and shifting risk appetite.
Arabica Managed money
Funds have cut net length sharply since March amid fading momentum.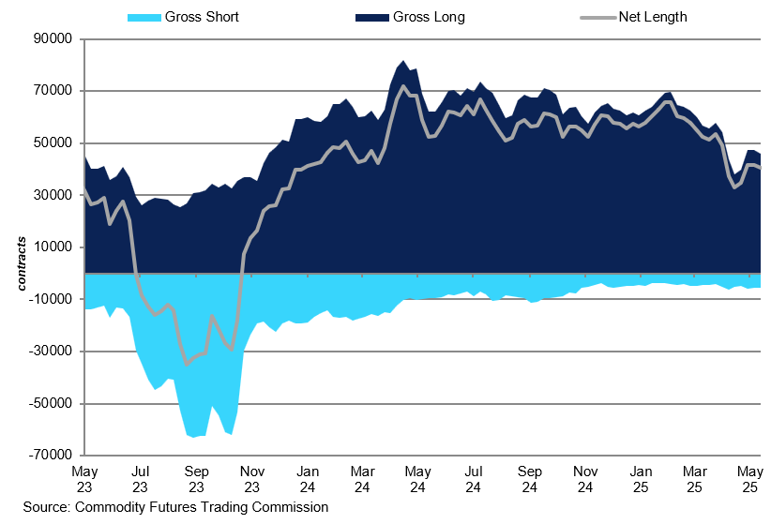
Commercial participants also adjusted their positioning. The net short position held by commercials stood at 58,577 contracts, narrowing from 91,355 contracts at the close of last year. This suggests a reduction in forward selling by producers and trade houses, potentially as a response to improved physical cover and reduced urgency to hedge forward exposure.
Arabica Commercials
Commercial net short has narrowed in recent months, reflecting slower origin hedging and improved roaster coverage.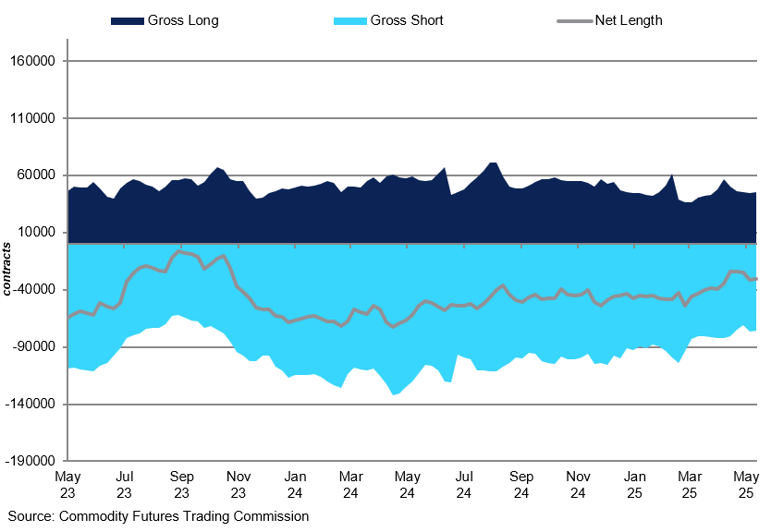
A closer look at market structure shows that open interest has also declined. Total open interest fell from 246,893 contracts at year-end to 190,384 as of late-May, a drop of nearly 58,000 contracts. This contraction in participation supports the view that the rally earlier in the year was largely driven by temporary positioning, and that current market levels are struggling to attract fresh speculative capital.
Compared with previous years, the current setup is much more balanced. While the year began with robust speculative length driven by fears of weather-induced supply losses, the present market appears to be in a holding pattern, waiting for clearer signals from Brazil’s upcoming harvest and from macro developments. It’s worth noting that, despite prices holding above key psychological levels, speculative money remains cautious, a dynamic that could limit upside follow-through unless triggered by new supply shocks or stronger demand signals. Until clearer signals emerge from Brazil or adverse weather shifts sentiment, speculative participation is likely to remain subdued, keeping the market in a holding pattern despite its underlying tightness.