


NY 2nd Month Sugar Futures
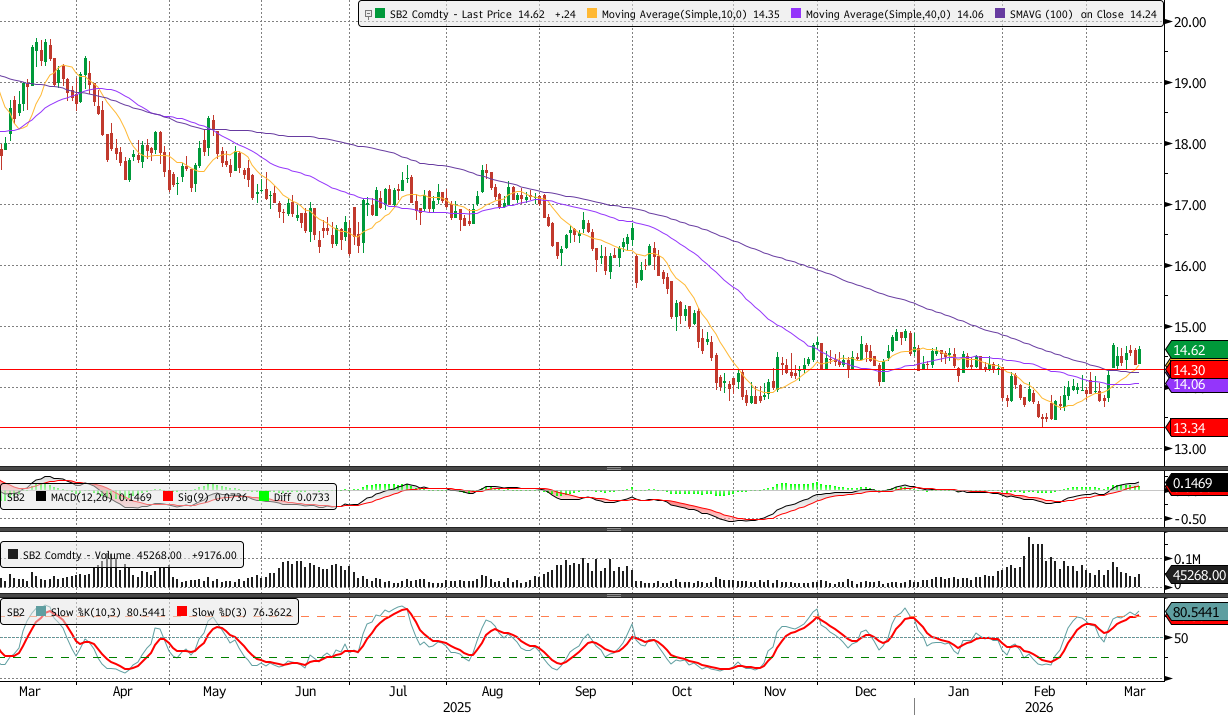
NY sugar futures extended their recovery on Tuesday, closing at 14.62, continuing to hold above the key DMA cluster, with the 10 DMA at 14.35, 40 DMA at 14.06, and the 100 DMA just below at 14.25, reinforcing a constructive short-term structure following the February base. Price action shows a clear shift from the prior downtrend into a stabilisation phase, with the market now consolidating above the former resistance at 14.30, which is acting as an important support pivot.
Momentum indicators remain supportive but increasingly stretched. The MACD diff remains positive and is still diverging, signalling that upside momentum continues to build, albeit at a slower pace than earlier in the rebound. Stochastics show %K above 80 and holding above %D, indicating overbought conditions, which suggests that while the trend remains constructive, the market may require consolidation before extending higher.
Technically, the ability to hold above 14.30 is critical. Sustained trade above this level would confirm the breakout and open the way towards the 15.00 area, which marks the next key resistance zone. However, failure to maintain this support would risk a pullback towards the 14.00-14.05 region, where the 40 DMA provides initial support, followed by the broader support zone at 13.34. For now, the combination of positive MACD dynamics and firm positioning above the moving averages suggests that the near-term bias remains cautiously constructive, though overbought stochastics point to the likelihood of near-term consolidation rather than an immediate extension higher.
Ldn 2nd Month Sugar Futures
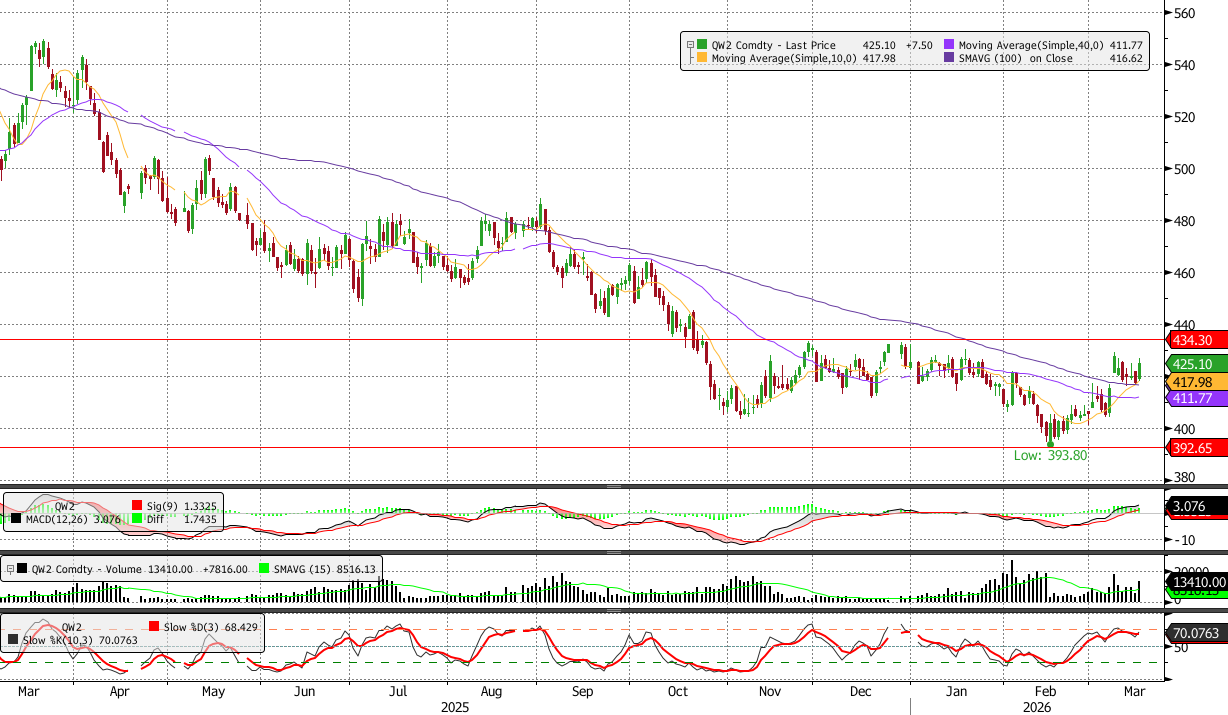
Ldn sugar futures strengthened further on Tuesday, settling at 425.10, decisively holding above the moving average cluster, including the 10 DMA at 417.98, 40 DMA at 411.77, and the 100 DMA at 416.62, confirming that the market continues to build on its recovery from the February low at 393.80. Price action has now pushed back towards the upper end of the recent range, with the market approaching the key resistance at 434.30.
Momentum indicators point to improving underlying strength. The MACD diff remains positive and continues to diverge, signalling strengthening upside momentum. Meanwhile, stochastics show %K rising above 70 and holding above %D, indicating firm upward momentum, although the indicator is approaching overbought territory, suggesting the potential for near-term consolidation.
From a structural perspective, the market is now trading firmly above the 420 pivot, which has transitioned into support following the breakout from the recent consolidation range. A sustained move above 425 would increase the likelihood of a test of the 434 resistance, and a break above this level would mark a more meaningful shift in the broader trend, opening the way for further upside. On the downside, support is now layered between 412 and 418, defined by the moving average cluster, with a break back below this zone likely to weaken the recovery and expose the 400 area once again.
Overall, the technical setup suggests that the near-term outlook remains cautiously constructive, supported by improving momentum and a firm hold above key averages, although proximity to resistance and elevated stochastics may encourage consolidation before any sustained move higher.
NY 2nd Month Coffee Futures
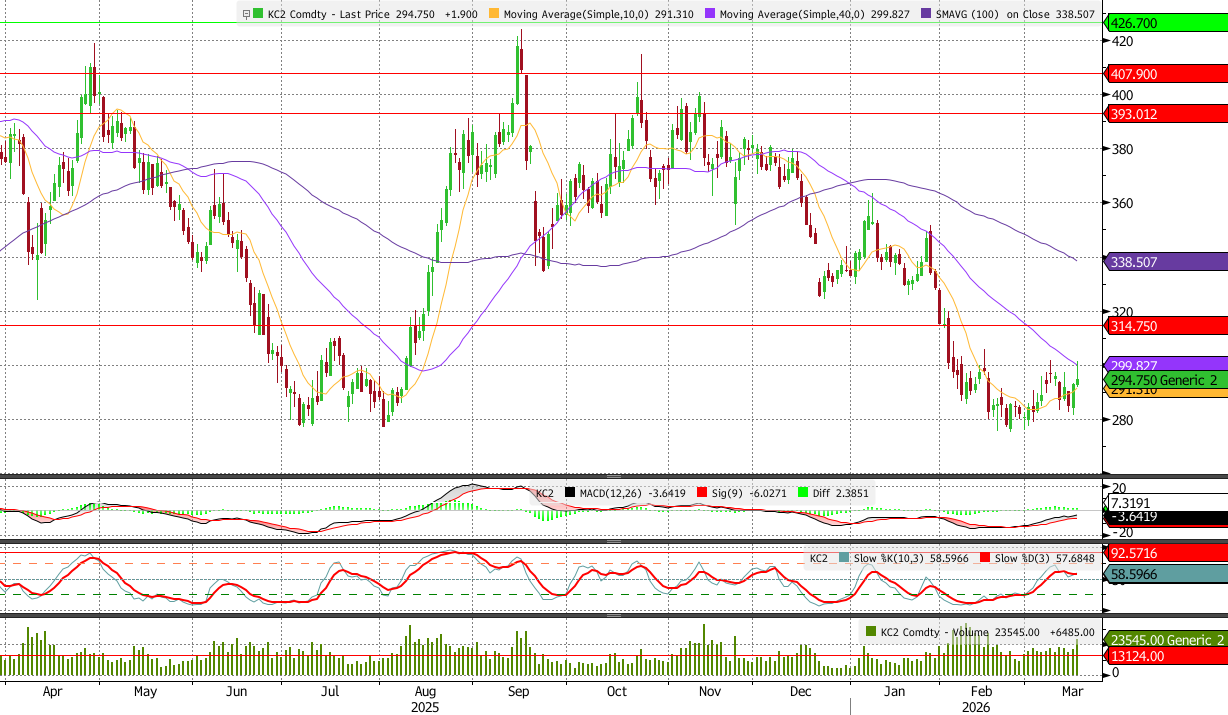
NY coffee futures rebounded modestly on Tuesday, closing at 294.75, but continue to trade below the key moving averages, with the 10 DMA at 291.31, the 40 DMA at 299.83, and the 100 DMA significantly higher at 338.51, indicating that the broader trend remains under pressure despite the recent stabilisation. The recovery from the February low near the 280 area has formed a tentative base, but price action remains capped below the 40 DMA, which continues to act as near-term resistance.
Momentum indicators suggest early signs of improvement. The MACD diff has turned positive and is beginning to diverge, indicating that downside momentum is fading and a short-term recovery phase is developing. Stochastics show %K around the high-50s, holding close to %D, pointing to a gradual build in upward momentum, though without entering overbought territory.
Technically, the 314.75 level remains the key upside trigger, marking the next significant resistance zone. A sustained move above the 40 DMA near 300 would strengthen the recovery structure and open the way towards this higher resistance. However, failure to break and hold above the 40 DMA would likely keep the market within a corrective phase. On the downside, support remains around 285–280, and a break back below this zone would expose the February lows and reinforce the broader bearish trend. For now, the setup suggests that the market is attempting to stabilise within a broader downtrend, with short-term upside potential conditional on a break above the 40 DMA.
Lnd 2nd Month Coffee Futures
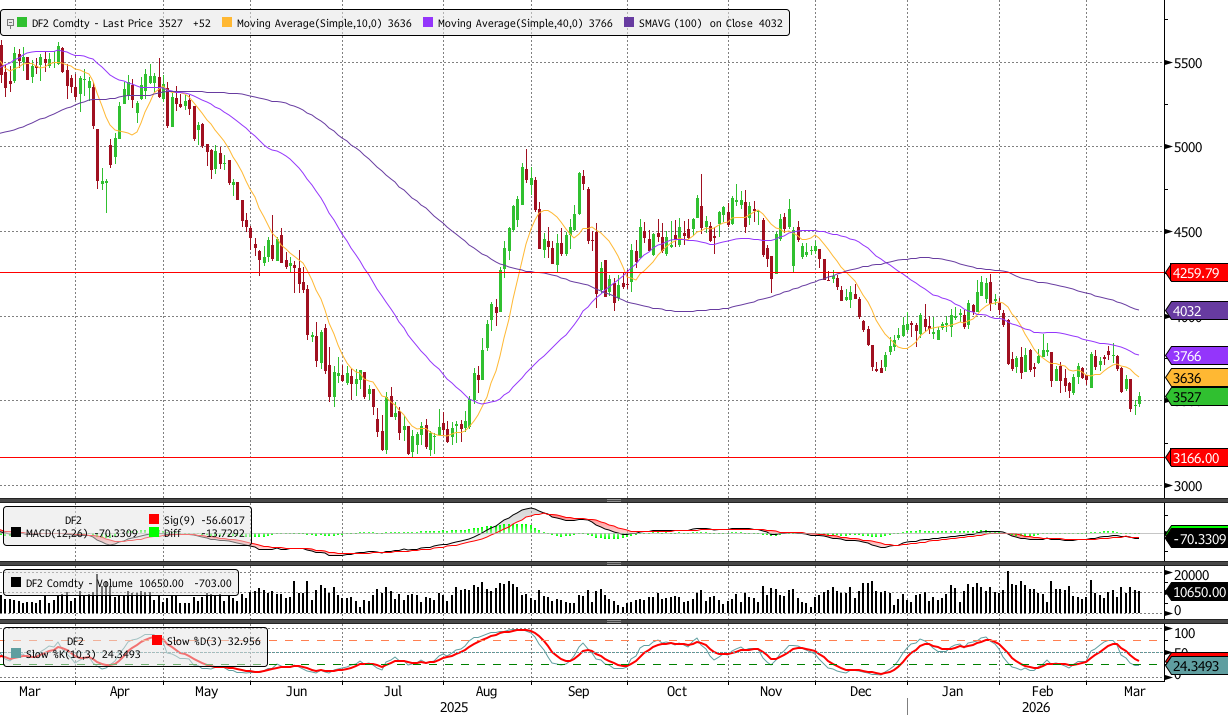
Ldn coffee (May) futures edged lower on Tuesday, settling at 3527, remaining below the key moving averages, with the 10 DMA at 3636, the 40 DMA at 3766, and the 100 DMA at 4032, confirming that the broader structure continues to point to a sustained downtrend. Price action remains weak following the January breakdown, with rallies continuing to be sold into, particularly below the 40 DMA.
Momentum indicators remain subdued. The MACD diff is close to flat but slightly negative, indicating that downside momentum has eased but not yet reversed into a clear recovery phase. Stochastics show %K around 24, below %D, placing the indicator in oversold territory, which suggests potential for short-term stabilisation, particularly near current support levels.
From a structural perspective, the market is holding above the 3166 support level, which continues to act as the key downside reference. However, the inability to reclaim the 10 DMA near 3636 keeps the near-term bias weak. A move back above the 10 DMA would be the first signal of stabilisation, while a break above the 40 DMA at 3766 would be required to shift the structure towards a more constructive outlook. On the downside, a break below 3166 would confirm a continuation of the broader downtrend and expose lower levels.
NY 2nd Month Cocoa Futures
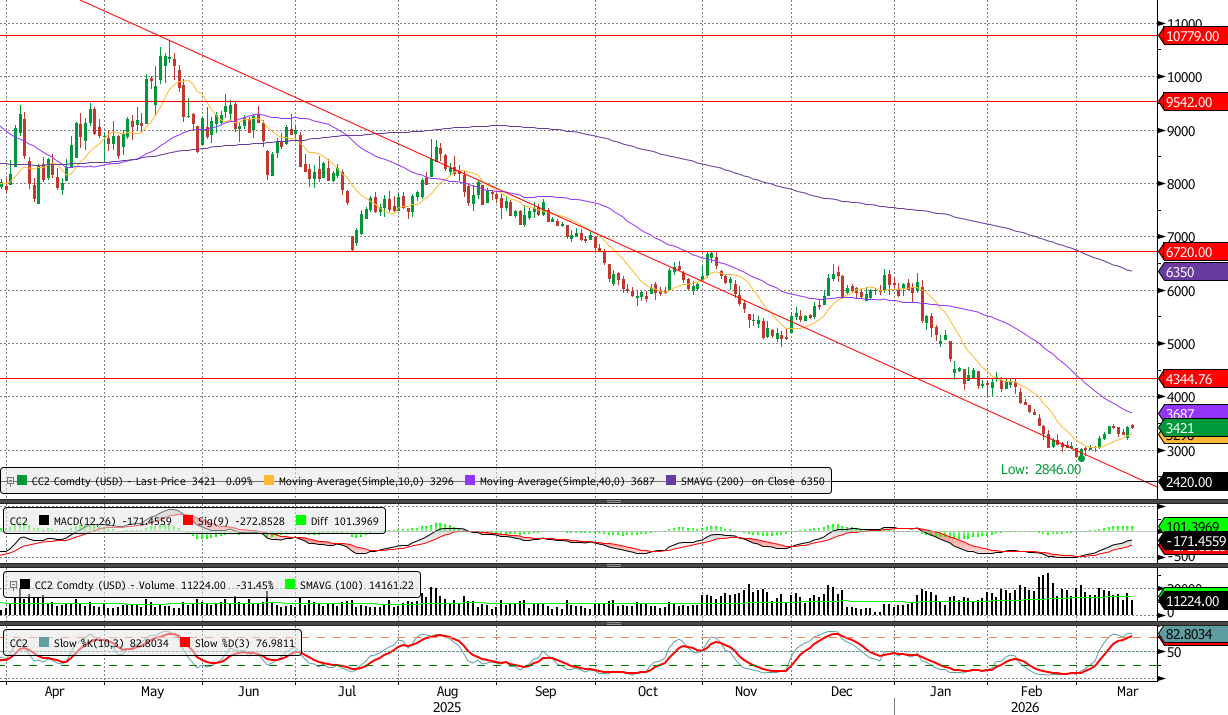
NY cocoa (May) futures recovered further on Tuesday, settling at 3421, extending the rebound from the February low near 2846, but remaining below the key moving averages, with the 10 DMA at 3296 now reclaimed, while the 40 DMA at 3687 and the 200 DMA at 6350 continue to cap the broader structure. The break back above the 10 DMA signals improving short-term conditions, although the market remains firmly within a broader downtrend.
Momentum indicators have turned more constructive. The MACD diff is positive and continues to diverge, indicating that upside momentum is building following the sharp sell-off earlier in the year. Stochastics show %K above 80 and holding above %D, placing the market in overbought territory, which suggests that while the recovery is gaining traction, it may begin to slow or consolidate near-term.
From a structural perspective, the market has moved back above the 3147 support zone, which now acts as a key pivot. Holding above this level supports the recovery structure and could allow futures to test resistance near the 40 DMA around 3687. A break above this level would mark a more meaningful shift in the short-term trend and open the way towards the next resistance zone near 3930. On the downside, failure to hold above 3147 would weaken the recovery and risk a move back towards the 2800-2850 area, where the recent lows were established.
Ldn 2nd Month Cocoa Futures
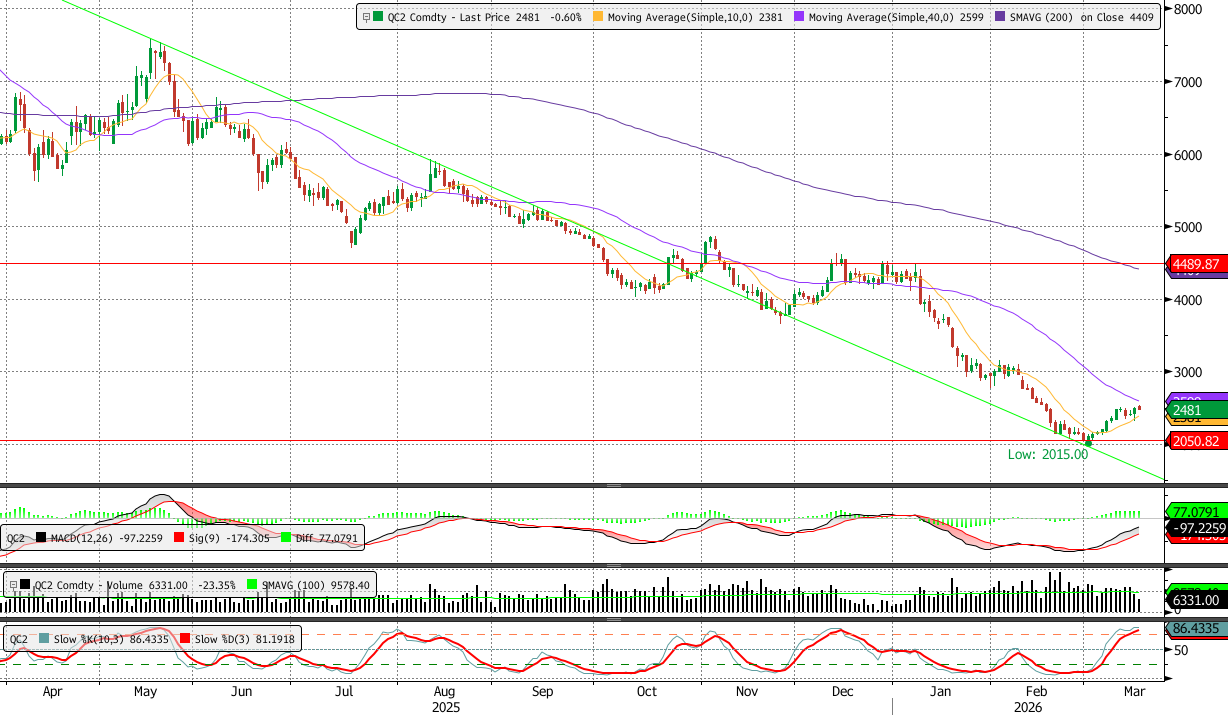
Ldn cocoa futures also extended their recovery on Tuesday, closing at 2481, rebounding from the February low near 2015, and moving back above the 10 DMA at 2381, while still trading below the 40 DMA at 2599 and well below the 200 DMA at 4449, indicating that the broader trend remains negative despite improving short-term conditions.
Momentum indicators confirm the strengthening rebound. The MACD diff has turned positive and is diverging, signalling that upside momentum is building. Stochastics show %K rising above 85 and holding above %D, placing the market firmly in overbought territory, which reflects strong recent buying pressure but also suggests the potential for near-term consolidation.
Technically, the market has reclaimed the 2480 area, which now acts as an important near-term pivot. Sustained trade above this level would support a continuation of the recovery towards the 40 DMA near 2600, which represents the next key resistance. A break above this level would strengthen the recovery structure and open the way towards higher resistance levels. On the downside, support remains near 2380-2400, defined by the 10 DMA, and a move back below this zone would weaken the recovery and risk a retest of the 2050 support area.
