


NY 2nd Month Sugar Futures
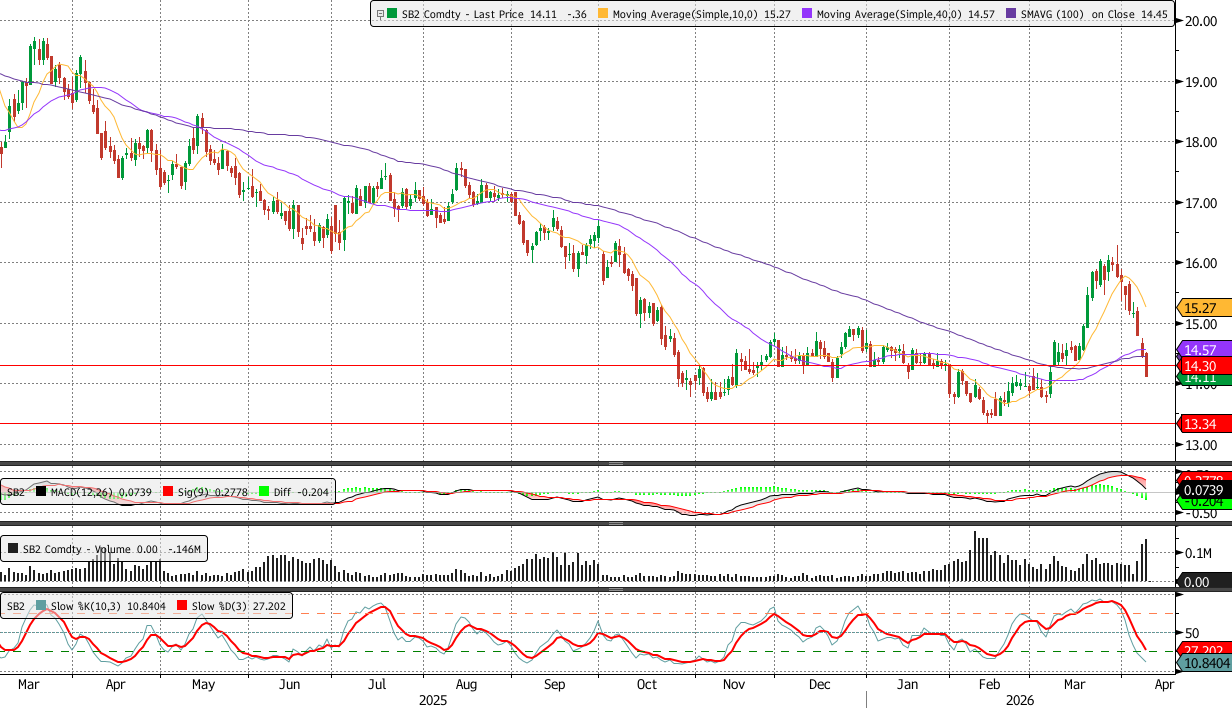
NY sugar settled at 14.11, extending the sharp reversal lower and moving back through key support levels after the recent rally failed.
Price action shows a decisive rejection from the 16.00 area followed by a sustained move lower, with the latest candle breaking back below both the 10 DMA (15.27) and the 40 DMA (14.57). The market is now testing the 14.30 support zone from below, indicating that the prior breakout has fully unwound and that this level is now acting as resistance.
Momentum has deteriorated notably. The MACD diff has turned negative and is widening, signalling that downside pressure is reasserting itself. Stochastics have fallen sharply into the lower range around 10–25, reflecting oversold conditions but not yet showing a clear reversal signal, suggesting that weakness may persist in the near term.
From a technical perspective, 14.30 is the key pivot. While below this level, the structure has shifted back to bearish, with rallies likely to be capped. Immediate support is seen at 13.34, and a break below would expose a move towards the recent lows. On the upside, a recovery would require a move back above 14.30 and the 40 DMA to signal stabilisation.
NY sugar has transitioned back into a bearish phase following a failed breakout, with momentum negative and price pressing into support.
Ldn 2nd Month Sugar Futures
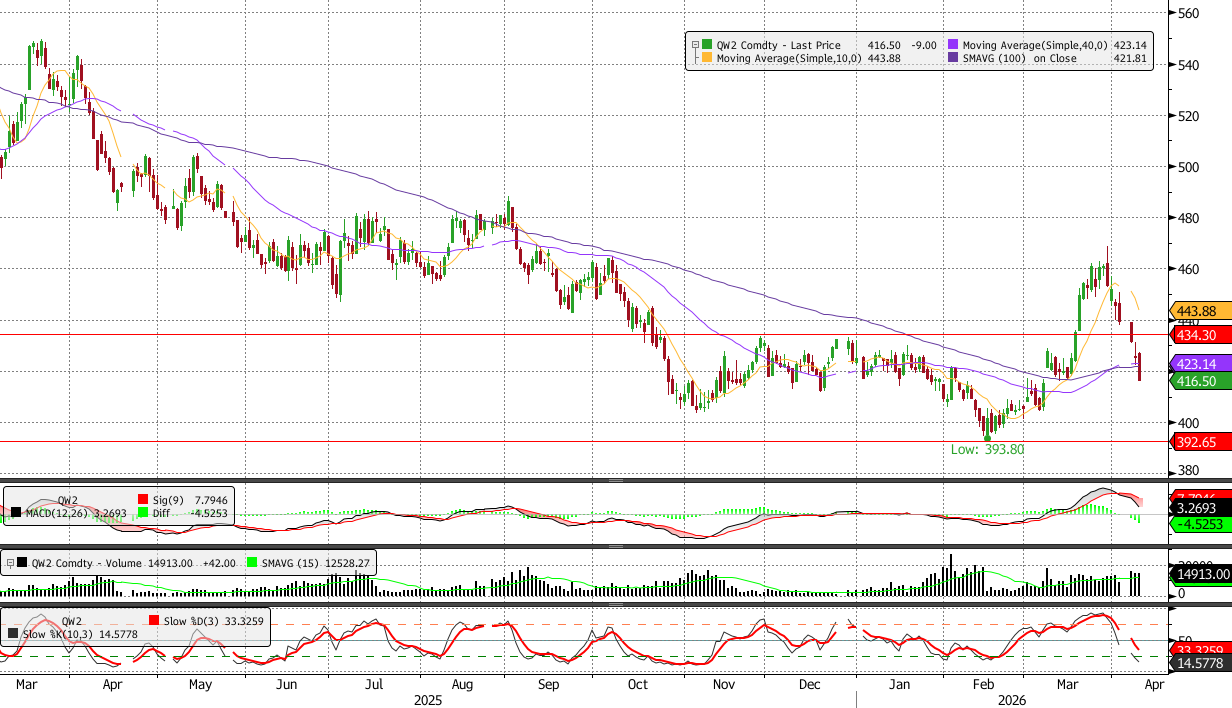
Ldn sugar closed at 416.50, continuing to weaken and confirming a breakdown below key support.
Price action shows a sharp rejection from the recent highs near 460 followed by a sustained decline, with the contract now trading below the 10 DMA (443.88) and the 40 DMA (423.14). The break below 434 confirms that the prior breakout has failed, and the market is now moving back into the previous range.
Momentum indicators reflect this shift. The MACD diff has turned negative and is widening, indicating increasing downside momentum. Stochastics have dropped sharply into the lower range around the mid-teens, pointing to oversold conditions but without a confirmed base.
Technically, 434 now acts as firm resistance, with additional resistance at the 40 DMA around 423 on any recovery. On the downside, the next key support lies at 392.65, marking the February low. A move towards this level appears increasingly likely unless the market can stabilise quickly.
Ldn sugar has moved back into a bearish structure after a failed breakout, with momentum turning lower and price breaking through key support, leaving the near-term bias to the downside.
NY 2nd Month Coffee Futures
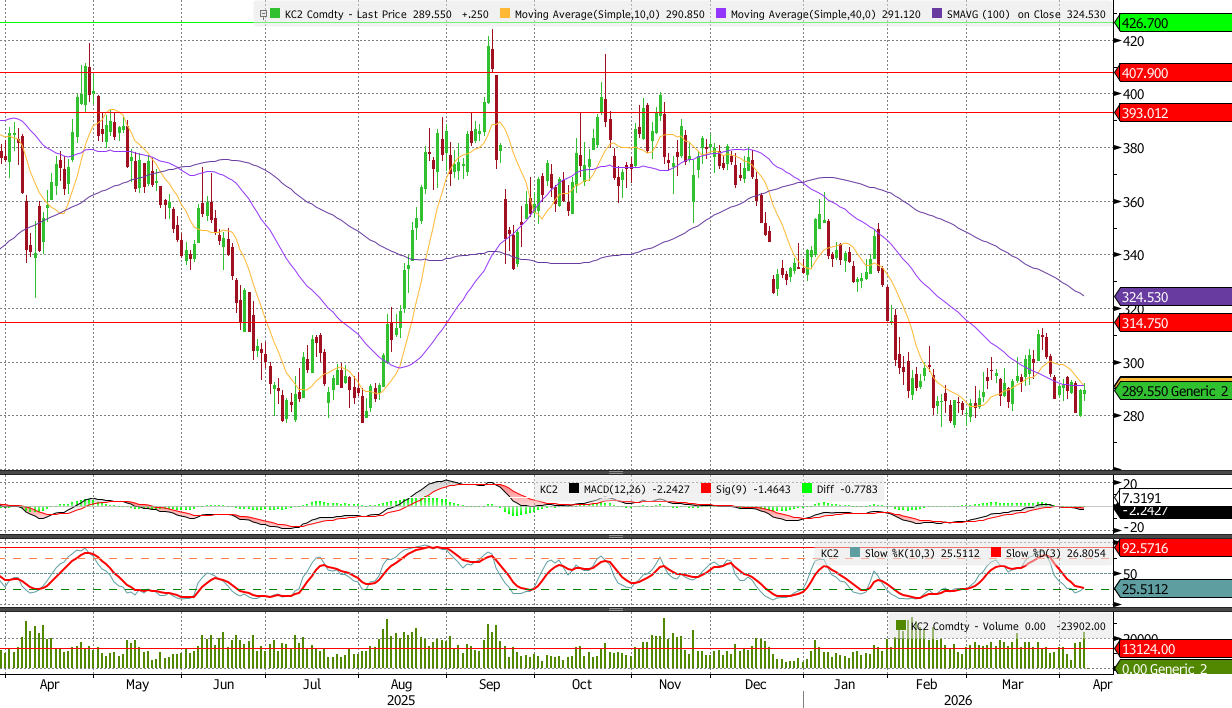
NY arabica coffee settled at 289.55, stabilising marginally but still trading within a broader corrective structure following the recent rejection from the 300 area.
Price action shows the market hovering just below both the 10 DMA (290.85) and the 40 DMA (291.12), with recent candles indicating a loss of downside momentum but no clear reclaim of resistance. The repeated failure to close back above this moving average cluster keeps the structure fragile, with the broader pattern of lower highs still intact.
Momentum is mixed. The MACD diff remains negative but is flattening, suggesting that downside pressure is easing rather than accelerating. Stochastics have pulled back sharply from overbought levels and are now in the lower range around the mid-20s, indicating the market is approaching oversold territory, which may support short-term stabilisation near current levels.
Technically, the 290–295 region remains the key pivot, defined by the 10 and 40 DMA. A sustained break above this zone would be required to signal a recovery towards 314.75. On the downside, support is seen around 280, followed by the February base near 270. A break below these levels would reassert the broader downtrend.
NY coffee is attempting to stabilise after the recent pullback, but the inability to reclaim the moving averages keeps the near-term bias cautious, with risks still tilted to the downside unless resistance is cleared.
Lnd 2nd Month Coffee Futures
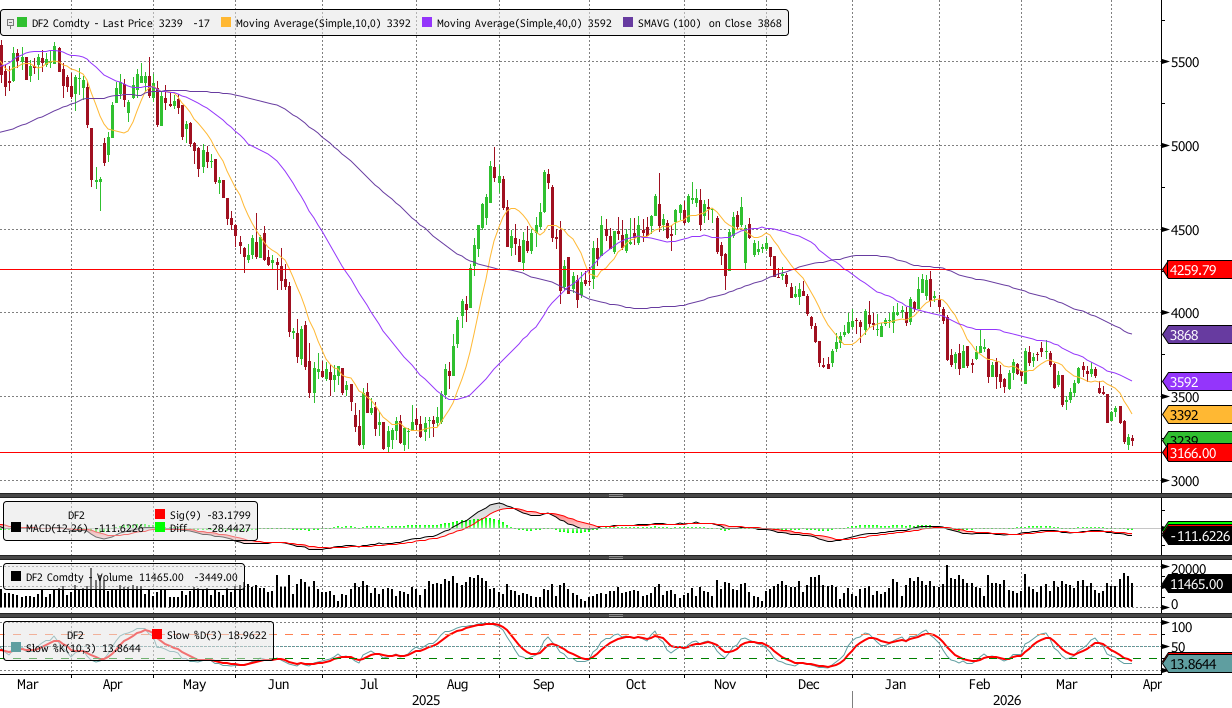
Ldn robusta coffee closed at 3239, continuing to trade under pressure and extending the broader downtrend.
Price action shows a clear sequence of lower highs and lower lows, with the market trading well below the 10 DMA (3392) and 40 DMA (3592). The latest candles push back towards the 3166 support zone, indicating that recent recovery attempts have failed and selling pressure remains dominant.
Momentum indicators remain firmly negative. The MACD diff is deeply negative and broadly flat, suggesting persistent downside pressure without meaningful recovery. Stochastics are in the lower range around the mid-teens, indicating oversold conditions, but there is no clear sign of a reversal yet.
From a technical perspective, 3390–3600 represents a strong resistance zone, combining the 10 and 40 DMA. While below this region, rallies are likely to remain corrective. Immediate support lies at 3166, and a break below would open a move towards 3000 and potentially lower.
Ldn coffee remains in a well-defined downtrend, with momentum negative and price pressing into key support. While the market is increasingly oversold, there is no confirmed base, leaving the near-term outlook biased to the downside.
NY 2nd Month Cocoa Futures
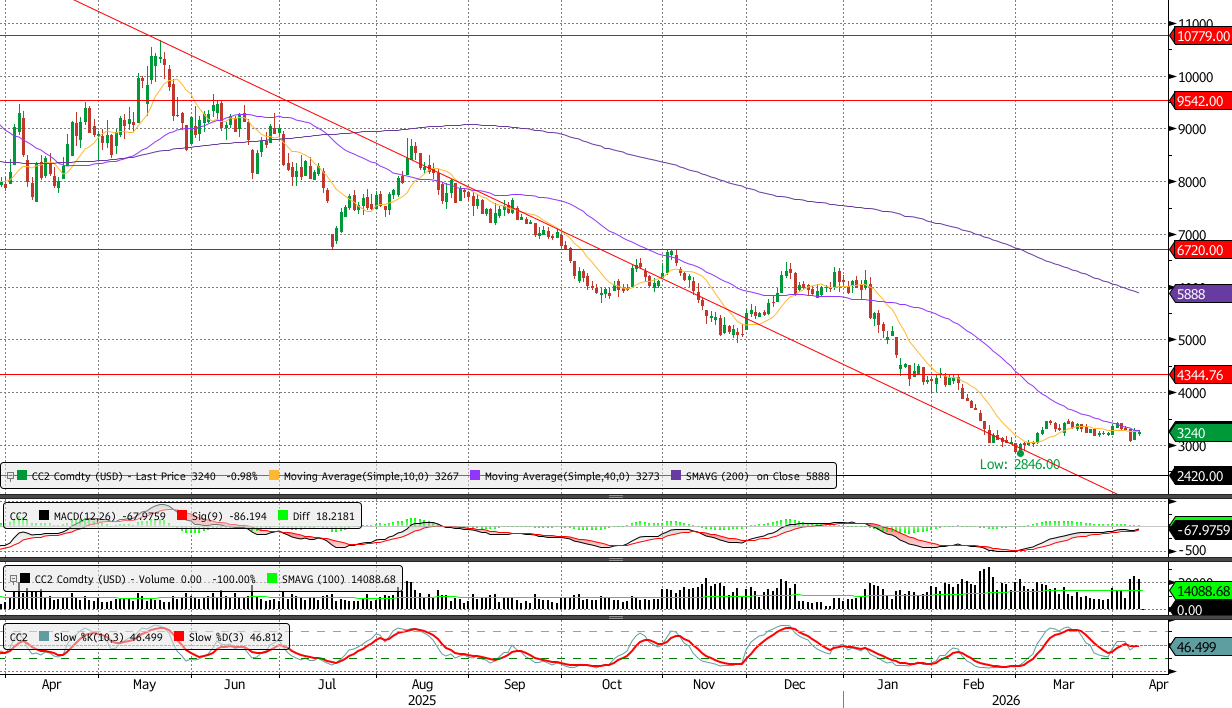
NY cocoa settled at 3240, holding broadly steady but continuing to trade within a well-defined longer-term downtrend.
Price action shows the market consolidating just above the February base near 2846, with recent candles clustering beneath both the 10 DMA (3267) and 40 DMA (3273). The inability to sustain a move above this moving average cluster reinforces that rallies remain corrective, while the broader sequence of lower highs remains intact beneath the descending trendline.
Momentum is showing early signs of stabilisation. The MACD diff remains positive and continues to edge higher, suggesting that downside pressure has eased, although the overall MACD structure remains deeply negative and consistent with a broader bearish trend. Stochastics are mid-range around the mid-40s and flattening, indicating a lack of strong directional conviction and reinforcing the current consolidation phase.
Technically, the 3265–3300 region marks immediate resistance, combining the 10 and 40 DMA. A sustained break above this zone would be required to signal a more meaningful recovery towards 3500 and potentially the 4000 area. On the downside, 3000 remains initial support, followed by the key structural low at 2846. A move back below this level would reassert the broader downtrend.
NY cocoa remains in a broader bearish structure but is stabilising above key support, with momentum suggesting consolidation rather than a confirmed reversal.
Ldn 2nd Month Cocoa Futures
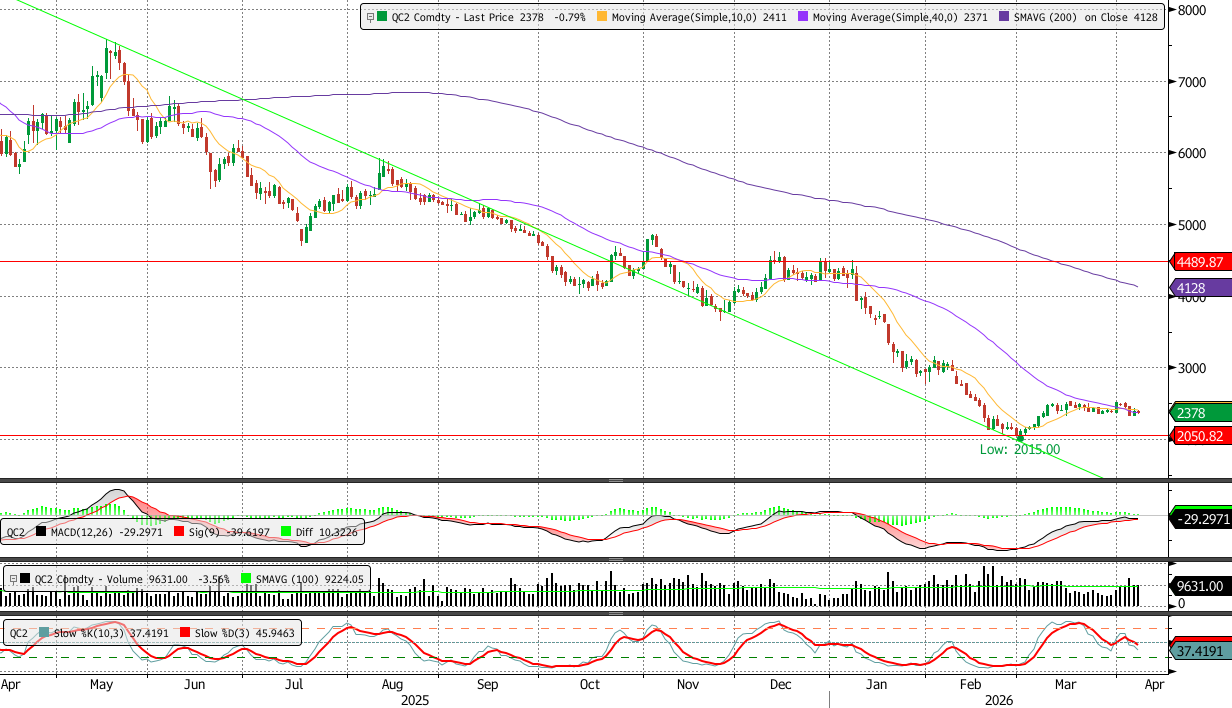
Ldn cocoa closed at 2378, continuing to consolidate near the lower end of its range while holding above the February low.
Price action shows the market trading just below the 10 DMA (2411) and marginally above the 40 DMA (2371), with recent candles reflecting a loss of upward momentum following the bounce from 2015. The broader trend remains lower, with price continuing to respect the descending structure from mid-2025.
Momentum indicators point to stabilisation but not reversal. The MACD diff is positive and gradually rising, indicating that selling pressure has eased, though the overall MACD level remains negative. Stochastics are in the mid-range around the high-30s to mid-40s, flattening and suggesting continued consolidation rather than a directional push.
From a technical perspective, 2400–2415 is the key resistance zone, defined by the 10 DMA and recent range highs. A sustained move above this area would open the way for a recovery towards 2600 and beyond. On the downside, 2050 remains the critical support level, marking the February low. A break below this level would signal a continuation of the broader downtrend.
In summary, Ldn cocoa remains under broader bearish pressure but is currently consolidating above key support, with momentum stabilising and the market lacking a clear directional catalyst in the near term.
