


Summary
As 2026 begins, metals markets are increasingly shaped by rotation rather than fresh macro shocks. Investor positioning is gradually shifting away from the US toward precious metals and selected emerging markets. The late-January sell-off unwound earlier excesses and pulled prices closer to fair value. While near-term conviction remains limited, this reset has reduced downside risks and leaves scope for sentiment to stabilise once momentum improves.
Copper continues to dictate market-wide behaviour, with heavy speculative participation and choppy trading conditions keeping volatility elevated across the complex. A more meaningful unwind of overextended positioning is still required before fundamentals can reassert themselves and support a more sustainable trend. Until then, spillover volatility into the broader base metals space is likely to persist.
Seasonally thinning liquidity into February and ahead of the Lunar New Year has amplified price sensitivity to marginal flows. Rising LME and CME inventories suggest physical players are front-loading deliveries to manage exposure during this low-liquidity window, a move that appears temporary rather than structural. Precious metals add a further risk channel: any renewed liquidation could distort short-term cross-commodity flows, reinforcing volatility without materially improving underlying fundamentals.
Watch our Q1 2026 Metals Market Webinar
Aluminium
Aluminium continues to trade as a proxy for copper, with speculative flows and thinning liquidity into the Lunar New Year driving elevated volatility. Near-term downside risk remains as positioning unwinds, with scope for prices to drift toward $2,900–2,950/t before a firmer base emerges. Beyond this, fundamentals should gradually tighten, with China operating near its production cap and restricted LME deliverability supporting a modest medium-term upside bias, contingent on copper’s direction.
Copper
Copper remains the anchor for the metals complex, but recent strength has been driven primarily by macro and speculative positioning rather than physical tightness. An unwind of extended longs is likely to keep price action choppy, particularly as liquidity thins into the Lunar New Year. US tariff uncertainty continues to pull material into COMEX, tightening availability elsewhere while lifting inventories globally. Downside looks corrective rather than structural, with strong support around $11,500/t, before the longer-term deficit narrative reasserts.
Lead
Lead remains largely disconnected from the copper-led rally, with low speculative participation and flat fundamentals keeping prices range-bound. Softer battery demand, weaker exports and a shift toward primary supply have left the market broadly balanced, limiting scope for a sustained breakout. While policy headlines can trigger brief rallies, lead’s near-term price action is still likely to be driven by intraday moves in the wider base metals complex, with prices expected to oscillate within the $1,950–2,100/t range.
Nickel
Nickel’s recent rally has been driven by Indonesia quota uncertainty and speculative positioning rather than a confirmed tightening in physical supply. Elevated LME inventories and low cancelled warrants continue to signal loose balances, capping upside as momentum fades. With stainless and battery demand still subdued, prices remain vulnerable to retracement once policy-driven enthusiasm unwinds. We expect nickel to remain volatile but unstable, consolidating at higher levels within a $16,300–18,300/t range through Q1.
Tin
Tin has become increasingly flow- and liquidity-driven, with rebuilding LME and SHFE inventories easing nearby tightness and removing upside reinforcement. The unwind in managed money length has left the market fragile, prone to sharp two-way moves and weak follow-through. While the longer-term structural tightness narrative remains intact, near-term price action is likely to stay volatile and corrective, with limited directional conviction. We expect tin to trade erratically within a $45,000–55,000/t range through Q1.
Zinc
Zinc opened the year strongly on synchronised speculative flows alongside copper and gold, but the unwind of squeeze-era tightness has seen spreads move back into contango as stocks rebuild. With refined surpluses projected to expand in 2025–26, zinc remains vulnerable to further speculative de-risking once flow support fades. Copper is likely to remain the primary short-term driver, though a more durable base may only form closer to $3,000/t. Upside appears capped unless copper rallies decisively.
Gold
Gold’s rally has shifted from fundamentally driven to increasingly momentum-led, leaving prices vulnerable to sharp reversals after an extended run. While gold has become a broader expression of macro and policy distrust, near-term price action remains dominated by speculative flows. That said, strong ETF inflows and continued central-bank buying provide downside cushioning, suggesting consolidation rather than a sustained reversal. We expect volatile, two-sided trade through Q1, with pullbacks serving to reset positioning rather than undermine the broader bullish backdrop.
Silver
Silver has entered a highly flow-driven phase, with price action dominated by speculative and CTA positioning rather than physical fundamentals. Despite ongoing structural tightness, silver’s high beta and strong macro linkage leave it vulnerable to sharp corrections at elevated prices. Volatility is likely to remain pronounced, with upside dependent on renewed inflows and downside limited but uneven, as positioning shifts continue to drive exaggerated moves.
Platinum & Palladium
PGMs remain highly sensitive to flows due to thin liquidity, amplifying volatility and muting near-term fundamental signals. Platinum stays structurally supported but increasingly range-bound as balances move closer to neutral and profit-taking risks rise. Palladium offers higher beta within the white-metals rotation but remains more vulnerable to pullbacks given its concentrated demand profile and supply responsiveness. Across both metals, Q1 price discovery is likely to be dominated by positioning and liquidity, favouring consolidation over extension.
Key Drivers
- Rotation toward precious metals and EMs: Investor positioning is gradually shifting away from the US and Europe and toward precious metals and emerging markets. The recent sell‑off has unwound much of the earlier overextension, bringing prices closer to “fair value.” While uncertainty around near‑term direction remains high, this reset creates room for more constructive sentiment to build once momentum stabilises.
- Copper remains the main driver of market-wide momentum: Volatility across the complex continues to be dictated by copper, where heavy speculative participation and choppy trading conditions persist. A meaningful unwind of overextended positions is still needed before fundamentals can reassert themselves and allow for a more sustainable trend.
- Thinning liquidity amplifies price action: Liquidity is seasonally declining into February and ahead of the Lunar New Year holiday period. This reduces selling power, increases sensitivity to incremental flows, and heightens intraday volatility. Rising LME and CME inventories indicate that physical players may be front‑loading deliveries to reduce exposure during this low‑liquidity window. These moves appear temporary rather than structural, and flows may normalise once markets reopen.
- Precious metals pose an additional risk channel: Further weakness in precious metals could create additional turbulence. While unlikely, any continued liquidation in precious could divert flows into base metals, adding another layer of noise to short‑term price action.
Macroeconomic Outlook
US
Markets are turning their attention to the US economy, aiming to gauge the impact of the evolving geopolitical, political, and economic landscape. We believe the economy is under more pressure than markets are currently pricing in, with two key risks that could shift the narrative toward a more dovish, pessimistic stance. Namely, potential mini-AI bubble bursts and US labour market weakness sparking recession-like fears across broader markets, even if those concerns ultimately prove unfounded.
Mini AI bubble bursts
With AI stocks continuing to grow for most of last year, we ask ourselves: is this driven by fundamental valuation growth or by the perception of AI demand?
We believe that the current optimism surrounding AI is driven more by investment in infrastructure to meet surging demand than by broad-based maturity in monetisation. In our 2026 Outlook report, we have analysed the current pace of infrastructure project timelines, which suggests that most AI data centres take 3-5 years to build on average. This indicates that, while the AI narrative is genuine, it remains in its early stages. The pace of expansion is largely governed by the availability of grid interconnections and cable supplies, which will ultimately determine the timing of actual metal demand.
S&P Information Index vs S&P 500
AI-led enthusiasm has driven equity valuations well ahead of economy-wide earnings growth.
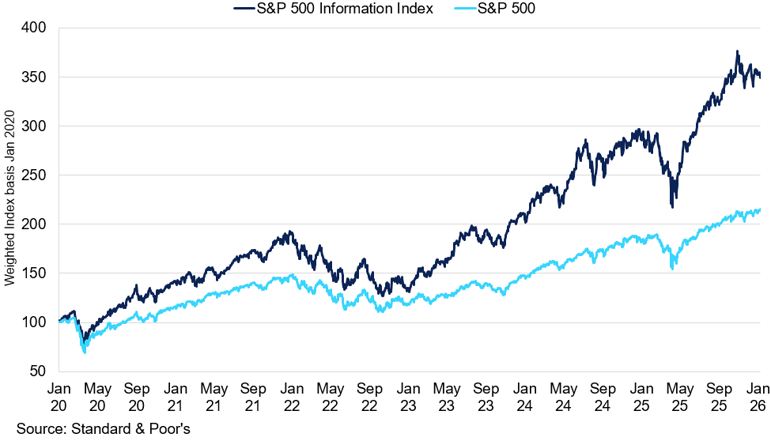
This suggests that the current valuation of AI-led growth significantly exceeds the current pace of revenue projections, especially if not accounting for revenues generated by infrastructure investments. The biggest risk in this environment is a sharp reversal in AI-driven equity valuations, which could trigger a broader tech-led market correction across asset classes. A significant correction would likely lead to substantial negative earnings surprises or shifts in market sentiment. Given how extended positioning and valuations have become, the reaction could be extreme once confidence cracks, which we expect to take place as tech earnings “normalise” in 2026.
This could result in a sharp correction in US equity markets as crowded longs unwind, leading to volatility spikes, with early signs becoming more prevalent after Microsoft’s disappointing Q1 results. This could also spill into broader risk sentiment as investors reprice growth expectations; a reversal would trigger correlation shocks, with equities, credit, and even commodities temporarily moving in sync.
US labour market outlook
Secondly, there are mounting concerns that the US labour market could weaken further in 2026, with some citing worries of unemployment rising to 6.0%. The main driver behind the slowdown is weaker hiring, a trend that began in 2025 due to high interest rates and policy uncertainty. Layoffs have remained low, indicating that the softness is more attributable to slow hiring than widespread job cuts.
Sahm Rule vs US Initial Jobless Claims
Sahm rule has been rising since summer 2025, raising the risk of labour-driven recession.
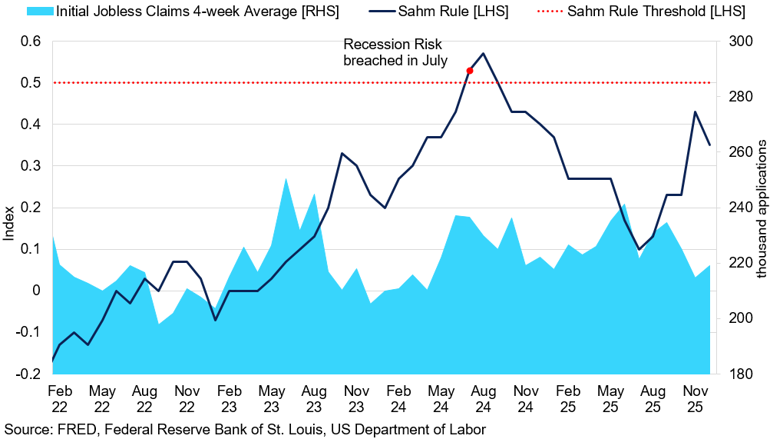
In our view, the outlook for 2026 depends on hiring trends, and there is a risk that unemployment could reach recession-signalling levels if current patterns continue. A key market focus is the Sahm rule, which signals recession if the three-month average unemployment rate rises by 0.5 percentage points above its 12-month low. As of January, the indicator is at 0.35, so there is still some cause for concern. Should the Sahm rule threshold be crossed, it could spark recession fears, market volatility, and increased demand for safe-haven assets, even in the absence of a GDP contraction.
Europe
We believe that Europe’s outlook hinges more on its relationship with the US than on its domestic performance, whether political or economic. Indeed, Europe remains unusually exposed to threats posed by confrontational trade imbalances, including tariffs or export controls. The baseline for trade frictions with the US is already high, and it tends to recur around political deadlines and industrial policy disputes.
In January 2026, the Greenland flashpoint led to renewed tariff threats from the US, ranging from 10% to 25%. Although a subsequent deal ultimately reduced the immediate risk, we believe the US may repeat this pattern in 2026, using tariff threats as a tool of political leverage against Europe. However, given the consistent tendency for such measures to be reversed or short‑lived in practice, any new tariff action is likely to follow a similar trajectory.
Eurozone CPI vs Core CPI (%)
Eurozone’s CPI stabilised at the ECB’s target, providing policymakers with greater flexibility to cut interest rates if economic conditions deteriorate.
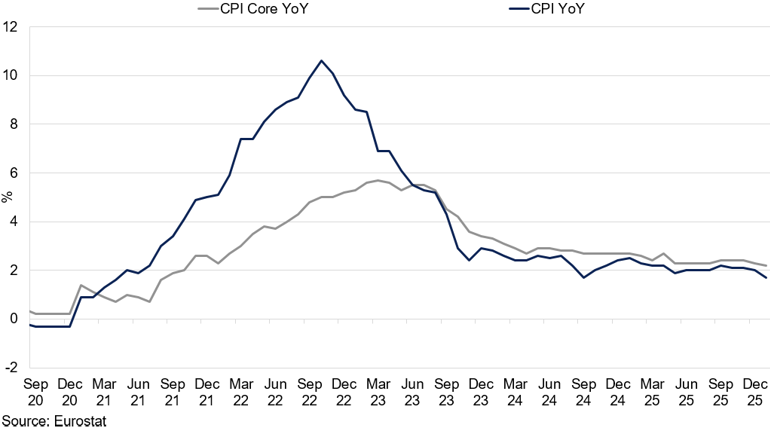
Domestically, the mood for the Eurozone’s performance has become more upbeat in recent weeks, with inflation at the ECB’s 2.0% target and labour performance still resilient, with euro area unemployment at 6.4%. However, there is a growing risk that economic performance deteriorates throughout the year, with downside becoming more prominent if exports or confidence weaken.
According to S&P Global Ratings, the euro area is expected to grow by 1.2% in 2026, down from the 1.3-1.4% seen in 2025. We anticipate Eurozone growth will moderate gradually, though downside risks would increase significantly if US tariffs were implemented and persist. However, we see sustained tariffs as unlikely.
China
In 2025, China met its “around 5%” growth target through resilient goods exports and a large fiscal impulse. Looking ahead, consensus expects growth to moderate rather than fall in 2026, but that outcome depends on the state maintaining a steady pace of support. Indeed, in 2025, China leaned on an unusually large fiscal package, including record special treasury bond issuance and expanded local-government bond quotas. From a monetary policy perspective, the PBoC eased in mid-2025 through policy rate cuts, an RRR cut, and lower benchmark lending rates. Maintaining this pace will require similar investment levels going forward.
The key risk is that the growth mix becomes more imbalanced over time. China’s trade surplus reached $1tr by November, underscoring how much growth is leaning on external demand. With limited scope to counter protectionism and persistent imbalances with Europe and Mexico, exports are likely to face stronger headwinds in 2026. The US-China trade truce lasts until November 2026, but renewed trade tensions remain a material risk.
China Trade Balance with US and Global
Despite the tariff implementation in 2025 reducing trade balance with the US, China continued to grow its balance with the rest of the world. 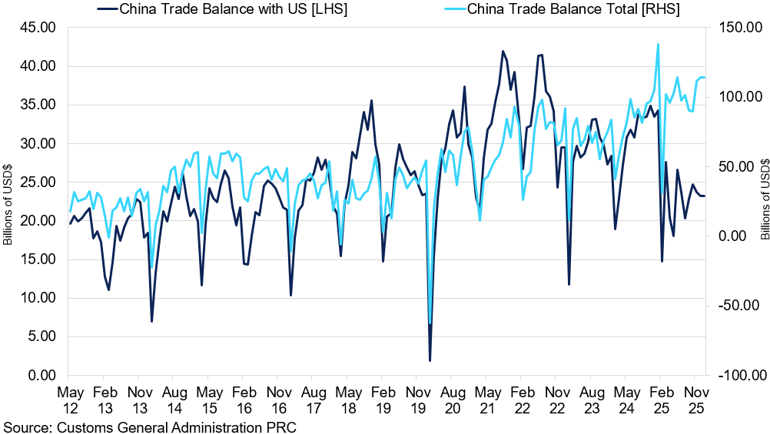
That external drag raises the bar for domestic demand to carry more of the load. However, with limited scope for broad monetary easing, the policy burden shifts toward fiscal tools. As a result, China has pledged to broaden fiscal spending in 2026, signalling continued government support amid external headwinds. The emphasis on advanced manufacturing, tech innovation, and human capital reflects a deliberate pivot: fiscal policy is being used not just to smooth the cycle, but to steer the direction of growth.
Aluminium

Key Points
- Aluminium continues to trade as a proxy for copper, with price volatility likely amplified by thinning liquidity into the Lunar New Year.
- Speculative flows remain the dominant force, creating sharp swings and leaving room for a pullback toward $2,920/t before a more stable floor forms.
- Fundamentals should gradually reassert themselves, with China’s capped output and restricted LME inventories tightening the medium‑term structure and supporting a modest upside bias.
Aluminium’s price structure continues to closely follow copper’s price action, acting as a proxy, especially during periods of heightened volatility or structural change, rather than its own fundamentals. As copper pushed to record highs, aluminium climbed to its highest level since July 2022, reaching $3,350/t by the end of January. We expect this mirroring dynamic to persist through the remainder of Q1 2026, though minor divergences may emerge, highlighting that the correlation is strong but not definitive.
One important difference is aluminium’s steadier physical hedging flow, which traditionally keeps the market more balanced in normal volume conditions. However, when volumes spike, especially at elevated price levels, aluminium becomes more vulnerable to sharp, short term downside moves, as some financial players scale back their long exposure. Copper, by contrast, often sees commercial buyers step in during sell offs, which cushions the price support more strongly but keeps intraday prices more volatile in either direction. This means aluminium is more exposed to liquidity-driven volatility during high-volume sessions, while copper pullbacks are more likely to be absorbed and remain corrective.
As a result, we believe aluminium tends to be more sensitive to speculative de-risking during the times of positioning unwind. Indeed, recent price swings, including the pronounced weakness in early February following sell-offs in precious metals, highlight how active speculative participation still is. We see scope for aluminium to drift toward $2,920/t before systematic selling fades and a more stable floor forms.
Once this phase passes, the fundamental backdrop should become more solid, setting the stage for a gradual rebuilding of market appetite. Despite ample global supply, we expect structural inventory tightness to grow over the coming months. China is operating near its government-mandated production cap, and 2025 production growth has slowed from 4% to 2%, pointing to limited exports. This is compounded by an 11% drop in regional aluminium exports following the removal of the tax rebate.
While LME inventory saw a modest jump of 26,200mt in January, we believe that this is related to Chinese physical players front-loading deliveries ahead of the holiday period, reducing exposure while liquidity thins. Additionally, with Russian aluminium now accounting for majority of LME-registered stocks, which cannot be shipped to the US, arbitrage flows are restricted. These factors all contribute to a tighter fundamental structure as LME stocks are drawn down with minimal replenishment. As a result, we expect price volatility across the broader metals complex to amplify as the Lunar New Year holiday approaches, keeping momentum choppy.
Q1 Outlook:
After speculative excess is cleared out, we expect a gradual recovery in aluminium, with price direction still heavily tied to copper. The market is likely to remain volatile in the near term, but medium-term fundamentals are constructive, supporting a slow rebuild in sentiment and a modest upside bias.
Copper

Key points
- Copper’s rally has been driven more by macro and speculative flows and an unwind of overextended longs is likely to keep price action volatile.
- Ongoing US tariff uncertainty has pulled material into COMEX, tightening availability elsewhere.
- Thinning liquidity around the Lunar New Year and rising global inventories point to erratic price discovery in the weeks ahead.
Copper remains the trendsetter for the rest of the complex. The shift in copper’s structure began in September 2025, when Freeport’s Grasberg mine announced a ~0.5mt production shutdown, flipping the market from surplus to a finely balanced state. This triggered a repricing higher, eventually pushing copper to $13,400/t, though this move was largely driven by speculative flows than underlying fundamentals. Indeed, the growing correlation between base and precious metals, especially in recent weeks, has underscored that copper’s price action is now dictated more by macro positioning than by traditional metal-specific signals. As a result, we expect market behaviour to remain volatile, alternating between periods of quiet trading and extreme swings.
We believe that the key factor for copper’s next move is the unwinding of overextended speculative positions. Until this plays out, a sustainable upside will be challenging to establish. Once current market volatility eases and participants are able to defend a new floor, trading is likely to remain choppy, driven more by technical and news flows than by fundamentals.
In the US, the threat of tariffs remains a major overhang for the copper market. Persistent concerns that tariffs could be reimposed in 2026 have led to accelerated shipments to COMEX, effectively locking material within the US and tightening available supply. As of January 2026, renewed tariff fears pushed local inventories to 0.58mt. All eyes are on the June deadline for the Department of Commerce to deliver an update on US tariffs on copper, particularly on the refined material. The department previously proposed a 15% levy starting in 2027, increasing to 30% in 2028.
Copper Outlook: Mining Risks, US Tariffs, Liquidity Concerns
In the coming weeks, seasonally thinning liquidity into the Asian holiday period is likely to amplify price swings. Rising LME and CME inventories alongside a jump in SHFE-deliverable material point to physical players front-loading deliveries ahead of this holiday break. This is likely an effort to reduce exposure while markets are less liquid, as re-hedging risk post-holiday could be significant and costly. As a result, price discovery should remain particularly choppy in the near term.
These recent speculative unwinds and inventory builds mark a material shift in market structure. Most base metal spreads have now moved into contango, suggesting there is no immediate vulnerability in any single metal. Even if speculative flows continue to unwind, a major collapse is unlikely, with $11,500/t is seen as a strong support level. However, this still implies as much as $1,500 downside from current levels if unwinding accelerates.
Q1 Outlook:
We do not expect speculative activity to disappear any time soon. In fact, inflows from participants anticipating a tightening global copper structure are likely to persist, especially as copper is set to enter a period of strong deficit by the end of the decade. However, before a sustainable upside can return, the market will likely need to unwind its overextended speculative positions, potentially sending prices lower before a more bullish structural momentum can reassert itself. In the meantime, we anticipate continued volatility and choppy price action, particularly during the Lunar New Year, as price discovery remains dominated by technical signals over fundamentals.
Lead

Key points
- Lead has remained largely disconnected from the copper-led rally, with low speculative participation and flat fundamentals keeping prices confined within the 1,950–2,100/t range.
- Softer battery demand, weaker exports, and a shift toward primary supply have left the market balanced, limiting the scope for a sustained directional break.
- While policy headlines can spark brief rallies, lead’s near-term moves are still likely to be driven by intraday copper price action rather than any meaningful change in its own market structure.
Lead appears somewhat disconnected from the copper-led momentum. While it tends to follow broader trends during periods of strong speculative appetite, this influence has not been sufficient to push lead prices out of their established 2025 range. Throughout most of last year, lead prices moved sideways, oscillating between consecutive gains and losses but ultimately holding within a range. As other base metals began reaching new highs amid increased speculative participation and a broadly bullish narrative, lead’s structural underlying remained flat. This divergence meant that, while volatility expanded across the complex, lead’s price swings still stayed contained within its usual band.
The metal’s fundamentals have remained largely unchanged in recent months. By the end of 2025, lead supply growth was increasingly driven by primary smelting, while secondary supply weakened into December. On the demand side, operating rates eased in late December as some battery producers cut output, and battery exports were down ~12.8% YoY in 2025, reinforcing a softer external-demand backdrop. As a result, with one of the lowest levels of investment fund participation in the complex, apart from a traditionally illiquid tin, speculative activity in lead tends to drive short-term, intraday moves but lacks the conviction to break prices out of their established ranges.
Lead’s addition to the critical minerals list briefly pushed prices up to $2,100/t in November. This addition has prompted renewed questions about lead’s fundamental importance in the US market, especially after President Trump’s proposal for a $12bn mineral stockpile aimed at reducing reliance on Chinese exports. To assess the impact, we constructed a supply chain “importance” metric for the US: a metal’s score increases with higher import reliance and the need for regular, consistent procurement. Lead’s import reliance is just 28%, the lowest among the group, giving it the smallest importance score and indicating it is the least strategically vulnerable. With most US lead supply being secondary, stockpiles could be replenished quickly if supply chain pressures intensified. Still, while headlines can influence prices, we remain cautious about the sustainability and fundamental justification of such moves.
Q1 Outlook:
Lead’s fundamentals remain broadly unchanged, leaving most of the directional performance dependent on appetite within the rest of the base metals complex, and, in particular, copper. Lead’s intraday performance is likely to remain largely influenced by copper in the near term, fluctuating between the $1,950/t and $2,100/t support and resistance levels.
Nickel

Key Points
- The recent rally has been driven by Indonesia quota uncertainty and speculative futures positioning.
- Elevated LME inventories and low cancelled warrants continue to cap upside and signal loose physical balances.
- Demand remains weak across stainless and batteries, leaving prices vulnerable to retracement as momentum fades.
Nickel entered 2026 with market focus shifted from entrenched surplus conditions toward Indonesia-driven supply uncertainty. Prices reacted aggressively to this change in narrative, with LME nickel rallying from just below $14,000/t in mid-December to a peak near $19,000/t by mid-January. While the scale of the move reflected genuine concern around future ore availability, it was also amplified by speculative positioning and futures-led momentum, particularly across Chinese markets. Late-January saw part of this speculative premium unwind, with prices retracing toward $17,000/t, highlighting the extent to which recent gains had run ahead of confirmed changes in near-term fundamentals. From a broader perspective, it is important to acknowledge that the recent surge follows nearly two years of exceptionally depressed price levels, during which nickel traded well below incentive pricing for much of the cost curve.
The catalyst for the rally has been renewed uncertainty surrounding Indonesia’s 2026 mining quota (RKAB) framework. Expectations that authorities would tighten ore approvals have encouraged the market to price in supply risk well ahead of any confirmed reduction in output. However, Indonesia’s quota system remains opaque and highly flexible, with scope for revisions later in the year. As a result, nickel has repeatedly traded on headline risk before retracing as details emerge, reinforcing the volatility of the current policy-driven narrative. Importantly, while ore availability concerns may affect cost structures and sentiment, there is still limited evidence at this stage of a material reduction in downstream NPI or MHP output.
Inventories continue to act as the market’s primary reality check. Despite the recent rally, episodes of large LME inflows have repeatedly capped upside, highlighting that surplus refined metal remains readily available and can reappear quickly once speculative momentum fades. LME stocks remain elevated by historical standards, and cancelled warrants remain low, signalling a continued absence of physical tightness. This dynamic leaves nickel caught between supply-tightening rhetoric and the visible ability of surplus metal to re-enter the system, particularly in a market still dominated by futures trading rather than physical demand signals.
Price action has been led overwhelmingly by Chinese futures markets. Early January saw strong SHFE gains amid broader risk-on sentiment across base metals and heightened sensitivity to Indonesia-related headlines. However, this strength has not been corroborated by end-use demand trends. Seasonal softness in stainless steel production persists, with downstream demand subdued and restocking incentives limited. Stainless producers continue to operate cautiously amid weak construction-linked demand and compressed margins, while the battery sector shows no meaningful acceleration in nickel intensity. As such, recent price gains remain largely unsupported by consumption fundamentals.
Q1 Outlook:
We expect nickel prices to remain volatile through the remainder of Q1 2026, with direction largely driven by developments around Indonesian quota implementation and speculative positioning rather than underlying fundamentals. While prices may remain elevated relative to late-2025 lows, upside appears vulnerable to renewed inventory inflows and demand disappointment. In the absence of confirmed supply cuts rallies are likely to be challenged, with nickel prone to sharp retracements once policy-driven momentum fades. Overall, we see the market consolidating at higher but unstable levels through Q1 around $16300-18300/t.
Tin

Key Points
- Rebuilding LME and SHFE inventories have softened physical tightness signals and removed upside reinforcement.
- Managed money length has dropped significantly in recent weeks.
- Market remains fragile and flow-led, leaving tin prone to volatile, corrective swings.
Tin entered 2026 with price action increasingly detached from physical supply–demand signals and instead dominated by positioning and liquidity. Following a strong rally through late 2025, the market has shifted into an even more unstable phase, characterised by sharp two-way volatility and weaker follow-through as speculative conviction fades.
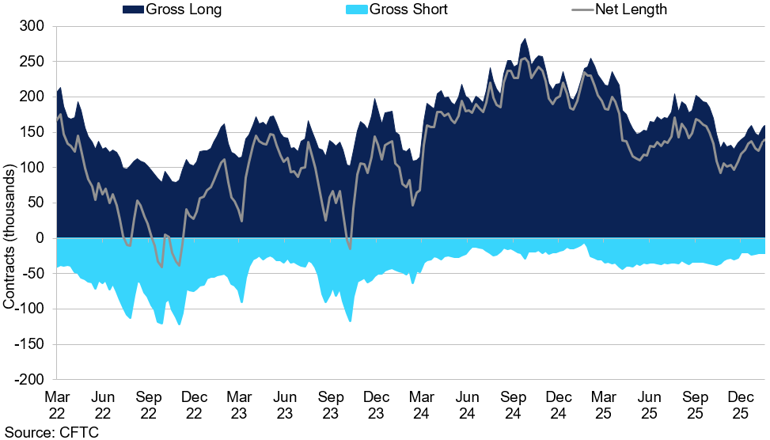
The late-2025 rally was underpinned by a steady build in managed money length, with net longs rising toward 6,000 contracts by November. Into year-end and early 2026, that positioning has begun to unwind, with managed money net longs falling to below 3,000 contracts, reflecting a clear reduction in risk appetite and a cooling of speculative engagement. With fewer committed longs anchoring momentum, tin has become more reactive to incremental flows rather than directional conviction.
Physical signals have also softened at the margin. SHFE inventories began rebuilding from November, marking an easing of the acute tightness seen earlier in Q4, when Chinese stocks were falling and LME inventories were sitting at historically low levels. More recently, LME stocks have risen to their highest levels since November 2023, reinforcing the perception that nearby availability has improved, even if absolute stock levels remain modest by longer-term standards. While the broader structural tightness narrative has not disappeared, it has been pushed firmly into the background for now, with inventories no longer reinforcing upside momentum in the way they did in late 2025.
Liquidity remains the market’s key vulnerability. Despite elevated headline trading volumes, activity continues to reflect speculative turnover rather than deep, resilient liquidity. Tin remains a small and structurally fragile market, where relatively modest position adjustments can transmit rapidly into price. As speculative length has been reduced, the market has become more sensitive to flows, particularly during risk-off episodes, when liquidity thins quickly and selling pressure can generate disproportionate downside moves. This fragility has been amplified by the broader metals complex, where heightened cross-market volatility has increased the frequency and intensity of short-term dislocations.
Looking ahead, the balance of risks appears skewed toward further position-driven corrections rather than a renewed, sustained rally. With inventories rebuilding and funds stepping back, price discovery is more vulnerable, and short-term moves are increasingly flow-led. Upside momentum lacks the positioning support that characterised the earlier phase of the cycle, and without a clear catalyst to rebuild speculative conviction, rallies are likely to remain fragile. A more convincing stabilisation would require a renewed influx of managed money length or a fresh physical tightening signal, neither of which appears likely in the near term.
Q1 Outlook:
We expect tin to remain highly volatile through the remainder of Q1 2026, with price action driven primarily by positioning shifts and liquidity conditions rather than underlying fundamentals. Near-term risks are tilted toward further corrective moves if speculative exposure continues to be reduced, particularly in periods of broader risk aversion. While the longer-term structural tightness story remains intact, it is unlikely to reassert itself meaningfully in the coming months. As a result, tin is likely to trade with elevated volatility and weak directional conviction through Q1, with prices prone to sharp, flow-driven swings. Expected range: $45000-55000/t.
Zinc

Key Points
- Zinc opened 2026 strongly, rallying to $3,575/t on synchronised speculative flows alongside copper and gold.
- The unwind of Q4 squeeze-era tightness has seen LME spreads move back into contango as stocks rebuild, leaving zinc oscillating between mechanical tightness and improving availability.
- With refined zinc surpluses projected at 125kt in 2025 and 330kt in 2026, led by China, zinc remains vulnerable to further speculative unwinds.
Zinc started 2026 on the front foot, repeatedly printing three-year highs, but the price action has been distinctly flow- and structure-led rather than driven by a clean macro or fundamental trend. Zinc prices have closely mirrored copper, showing some of the strongest positive correlations in the base metals complex. By late January, heightened speculative appetite led to synchronised moves across the metals space, with correlations between zinc, copper, and gold reaching new highs during periods of elevated trading volume. This surge in momentum propelled zinc to $3,575/t – the highest since August 2022.
The key development since late Q4 has been the gradual unwind of squeeze-era tightness. Following the ferocious October squeeze, LME stocks partially rebuilt into year-end as deliverable supply re-emerged, allowing nearby spreads to ease and briefly flip toward contango. This marked an important inflection point: while the squeeze premium has faded, the market has not transitioned smoothly into surplus pricing, leaving zinc oscillating between episodes of mechanical tightness and reminders of improving availability.
In early February, realised volatility increased as liquidity thinned, prompting participants to reduce short-term risk. The sharp pullback in zinc prices to $3,200/t was mainly driven by profit-taking and position clean-up, as reflected in the continued mirroring of precious metals. We believe that these moves do not signal a fundamental trend change. For now, zinc remains disconnected from its underlying fundamentals, making copper the key indicator for short-term direction.
Looking ahead, global production increases continue to outpace demand growth, leading to an expanding surplus this year. We project a surplus of 125,000t in refined zinc for 2025, doubling to 330,000t in 2026. China remains the key driver. According to SMM, Chinese zinc concentrate output is expected to increase by nearly 200,000t in metal content in 2026, accounting for more than 65% of this year’s supply growth.
While demand in China remains firm, there are potential demand gaps elsewhere. Both lead and zinc are included on the US critical minerals list, but zinc is the most exposed to supply chain risk, especially following the recent announcement of a $12bn critical mineral stockpile by the Trump administration. Our analysis, which weighs each metal’s vulnerability by import reliance and the need for regular purchasing, indicated that zinc tops the base metals for exposure, with 73% of US zinc consumption reliant on imports. Although zinc’s total tonnage is not the largest, this high import share explains its elevated risk level. We estimate about 0.5mt of annual US zinc consumption is imported.
Q1 Outlook:
Copper will likely remain the primary driver of zinc price discovery, heavily influenced by technical and news-driven flows. We anticipate that further speculative unwinding will be necessary before a solid support base is established, likely around $3,000/t, as long as spreads remain in contango and immediate availability stays loose. If flow-driven anxiety subsides, modest gains in zinc are possible. However, with the fundamental backdrop of a growing global surplus, any upside is expected to be capped unless a sharp rally in copper provides additional momentum.
Gold

Key Points
- Rally shifted from fundamentally supported to momentum- and positioning-driven, leaving prices vulnerable to sharp reversals.
- Gold has become a broader expression of macro and policy distrust, even as near-term price action is dominated by speculative flows.
- Strong investment demand provides downside cushioning, despite elevated volatility.
Gold entered 2026 in a different phase from late 2025, with the rally having transitioned from a fundamentally supported advance into an increasingly reflexive momentum-driven trade. Through January, price action accelerated sharply as upside momentum reinforced expectations of continuation and speculative positioning became crowded. Persistent geopolitical tensions, combined with deep uncertainty around US political direction under President Trump, pushed gold beyond its traditional role as a hedge and toward a primary expression of macro distrust. However, the final days of January saw that momentum unwind abruptly, with a sharp sell-off driving prices briefly down toward $4,500, highlighting how far short-term price dynamics had run ahead of near-term conviction.
Comex Gold Managed Money
Managed money net length has increased in the last two months of 2026.
Market attention has shifted away from the precise timing of rate cuts, with roughly two 25bp moves still priced for 2026, toward a broader and more destabilising question around the future conduct of monetary policy. The appointment of a new Federal Reserve chair, long critical of the Fed for acting too late, has reinforced uncertainty over whether policy decisions will remain tightly anchored to economic conditions or become more responsive to political and growth pressures, particularly if inflation allows room for faster easing. This shift has elevated gold’s strategic appeal, even as near-term price action remains heavily influenced by speculative flows and volatility rather than incremental macro data.
From a macro-financial perspective, the rally has been driven less by outright dollar selling and more by layered buying power. Gradual dedollarisation provides an anchor of confidence, while balance-sheet expansion and supportive credit conditions increasingly amplify price moves, with credit rather than cash now doing more of the work.
At the same time, strong investment demand continues to act as an important stabilising force, limiting the depth of pullbacks even as momentum trades are unwound. Total gold demand in 2025 exceeded 5,000 tonnes for the first time on record, supported by a sharp acceleration in bar and coin buying to a 12-year high and continued, geographically broad central-bank purchases of 863 tonnes. While official-sector buying slowed from prior peaks, it remains historically elevated and strategically significant, with countries such as Poland continuing to add to reserves. For near-term price dynamics, global gold ETF flows have been particularly influential: holdings rose by 801 tonnes in 2025, the second-strongest annual increase on record, lifting total ETF holdings to roughly 100.6 million ounces by late January, their highest level since 2022. This depth of investment participation helps cushion downside, even as positioning-driven volatility increases at elevated price levels.
Q1 Outlook
We expect gold to consolidate through the remainder of Q1 2026, with price action remaining volatile and two-sided following the late-January correction. Further downside remains possible as speculative positioning continues to adjust, particularly given that the move above $5,400 ran well beyond levels typically justified by healthy safe-haven demand. That said, the broader macro and institutional backdrop remains supportive, with geopolitical risk, policy credibility concerns and accommodative financial conditions limiting the risk of a sustained reversal. A healthier recovery is likely to be gradual and less momentum-driven, with prices gravitating around the $5,000 area rather than a rapid return to recent highs, and pullbacks serving to reset positioning rather than signal a fundamental trend change.
Silver

Key Points
- Price action dominated by speculative and CTA flows, leaving silver highly sensitive to positioning shifts.
- Physical tightness offers limited near-term protection against flow-driven corrections.
- High beta and macro-linked trading increase volatility and risk of sharp reversals at elevated prices.
Alongside gold, silver enters Q1 2026 in a more flow-driven phase, with price action increasingly dictated by speculative positioning rather than incremental shifts in physical fundamentals. While January’s rally was fuelled by strong participation from futures-based and macro investors, the sharp end-month pullback below $80/oz highlighted how sensitive the market has become to positioning changes. With price discovery now largely driven by systematic and CTA flows, silver remains prone to sharp extensions as well as abrupt corrections, particularly in an environment where elevated prices discourage producer hedging and amplify the role of investment demand.
On the physical side, industry estimates suggest the global silver deficit is expected to narrow over coming years following several consecutive annual shortfalls, but this does not imply an immediate easing of underlying tightness. Persistent deficits since the early 2020s have already drawn down above-ground stocks, reducing the buffer available to absorb renewed demand. Recent price strength has driven robust ETF inflows, tightening effective availability, while elevated lease rates indicate that access to prompt silver remains constrained even as headline inventories appear broadly stable.
Market structure reinforces this fragility. Nearby spreads have periodically tightened into backwardation, suggesting a premium for immediacy as balance sheets become less willing to warehouse risk. Higher funding costs and recent exchange margin increases have reduced market-making capacity, leaving silver more sensitive to large flows. This vulnerability is reflected in silver’s unusually high correlation with copper, which has approached 90% on a 30-day basis, pointing to macro positioning rather than metal-specific fundamentals as the dominant driver of price action.
Looking ahead, silver continues to benefit from the same macro backdrop supporting gold, including geopolitical uncertainty, US political risk, and broader de-dollarisation themes. However, its higher beta and sensitivity to flows leave price action less stable. Recent developments, such as the suspension of new subscriptions by China’s only dedicated silver fund due to elevated premiums, illustrate how enthusiasm can overshoot available liquidity, increasing downside risk when sentiment turns.
Q1 Outlook:
We expect silver to remain volatile through Q1 2026, with price action driven primarily by positioning, liquidity conditions, and broader macro confidence rather than near-term physical fundamentals. While structural tightness and investment demand continue to provide support, further corrections remain possible following the late-January unwind. Upside remains achievable if inflows re-accelerate, but gains are likely to be uneven, with silver continuing to exhibit high-beta behaviour and an elevated risk of sharp, flow-driven reversals. We expect moves above $100/oz to bring reversals, with downside capped at $70/oz.
PGMs

Key Points
- Thin liquidity makes PGMs highly flow-driven, amplifying volatility and shifting focus away from fundamentals.
- Platinum remains structurally supported but increasingly range-bound as balances move closer to neutral and profit-taking risks rise.
- Palladium offers higher beta within the white-metals rotation but is more vulnerable to pullbacks due to demand concentration and supply response.
Platinum and palladium enter the remainder of Q1 in a similar manner to gold and silver, but with different market mechanics. PGM markets are far less liquid and more episodic, meaning the same speculative forces driving the broader precious complex transmit more quickly and with greater amplitude into price. Recent price action has been violent in both metals, with platinum briefly trading above $2,900/oz before a sharp end-January pullback. This does not invalidate the medium-term supply narrative, but it shifts the near-term focus squarely onto flows and positioning rather than fundamentals.
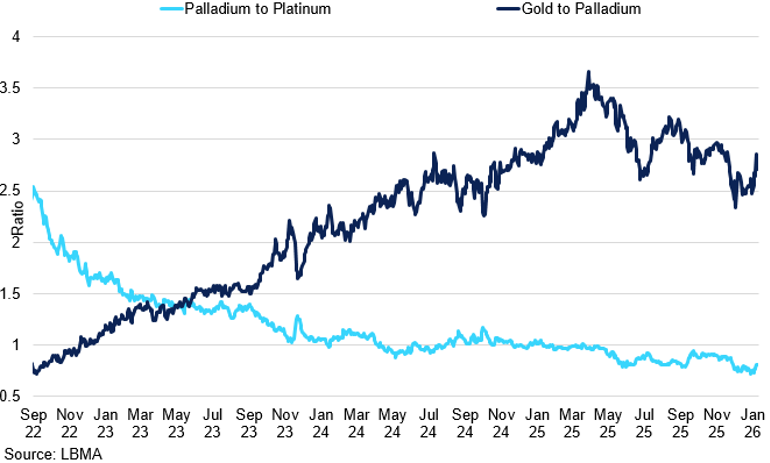
Palladium to Platinum vs Gold to Palladium Ratio
The gold–palladium ratio has corrected but remains historically elevated, while the palladium–platinum ratio continues to drift lower, reinforcing palladium’s relative underperformance within the precious metals complex.
Platinum remains structurally supported, reflecting the legacy of multi-year deficits that have depleted above-ground stocks and left the market prone to bouts of tightness when investment demand accelerates. However, the World Platinum Investment Council points to 2026 looking much closer to balance than the pronounced deficits of 2024–25, implying limited downside but making sustained upside harder to maintain without renewed prompt tightness or re-accelerating flows. ETF holdings have already moved back above roughly 3.3Moz, consistent with a broader rotation into white metals, but at elevated levels this also increases the likelihood of profit-taking. As a result, platinum is likely to remain supported through the next three months, with rallies becoming choppier and mean-reverting.
Palladium has also participated in the rotation into lagging precious metals, but the durability of its advance remains more questionable than platinum’s. Prices have rebounded since H2 2025, supported by relative-value demand and rising ETF holdings above roughly 1.2Moz, around one-and-a-half times higher YoY. However, palladium’s demand profile remains more concentrated in autocatalysts, leaving it more exposed to substitution and longer-term erosion from EV penetration. At higher prices, palladium is also more sensitive to supply response, reinforcing the risk that rallies invite corrective pressure.
Supply conditions offer supportive headlines but fall short of a clear constraint-driven bull case. With higher prices beginning to ease constraints at the margin, the next three months are likely to be characterised by two-way volatility rather than a sustained, linear repricing.
Q1 Outlook:
We expect platinum to trade supported but increasingly range-driven, with dips attracting buying but upside harder to sustain without renewed prompt tightness or fresh ETF inflows. Palladium should remain the higher-beta expression of the white-metals rotation, but with greater vulnerability to pullbacks if positioning fades. In both metals, price discovery is likely to remain dominated by liquidity and flows, leaving consolidation more likely than extension through Q1. We expect platinum between $1,900-2,500/oz, and palladium between $1,600-2,000/oz.

