


EUR / USD
Source: Massive (polygon.io)
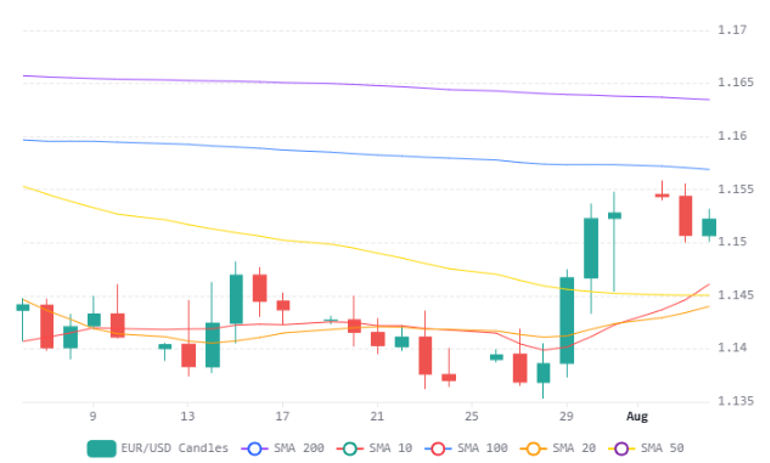
EUR/USD is trading around 1.1522, holding above the 20 day SMA at 1.1440 and the 50 day SMA at 1.1500, while the 200 day SMA near 1.1600 continues to cap the broader recovery. The daily RSI has improved to around 60, indicating constructive momentum without yet reaching overbought territory. The pair continues to trade within a relatively narrow range, suggesting investors are waiting for a stronger macro catalyst before committing to a clearer directional move.
The fundamental backdrop remains finely balanced. The Federal Reserve retains a broadly hawkish bias, with markets still assigning around a 55 to 60% probability of a September rate increase. However, a sharp decline in oil prices following signs of diplomatic progress between the United States and Iran has eased inflation concerns, pulling Treasury yields lower and reducing immediate pressure for further Fed tightening. In Europe, the ECB remains on hold, although inflation at 2.9% continues to leave the door open to additional policy tightening later this year, providing underlying support for the euro.
We expect Friday's US nonfarm payrolls report to provide the next major catalyst. A sustained break above 1.1550 would strengthen the case for a move towards the 200 day SMA at 1.1600, while failure to hold current levels could see the pair drift back towards support at the 50 day SMA near 1.1500.
USD / JPY
Source: Massive (polygon.io)
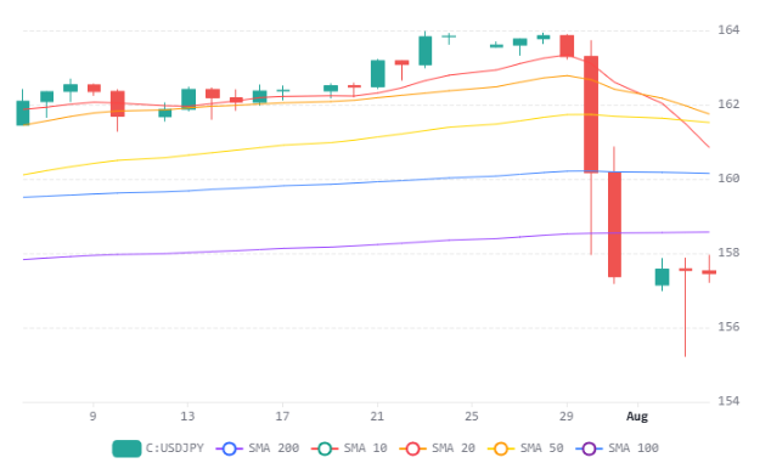
USD/JPY is stabilising near 157.45 following the historic coordinated US Japan intervention, which drove the pair sharply lower from the 164 area before buyers returned around 155. The intervention has eased immediate upward pressure, although the broader macro backdrop continues to favour the dollar through the sizeable interest rate differential between the Federal Reserve and the Bank of Japan.
Technically, the pair remains deeply oversold, with the daily RSI near 23 and price trading below the 20 day, 50 day and 200 day SMAs. Institutional buying interest around the 157.50 area suggests this level is becoming an important short term pivot, while the sharp decline has left room for a corrective recovery should selling pressure continue to fade.
Fundamentally, the yield differential of more than 250 basis points continues to support dollar demand, while higher energy costs remain an additional headwind for Japan's import dependent economy. Markets increasingly expect another Bank of Japan rate increase in September, although we continue to see the pace of policy normalisation as too gradual to fundamentally alter the medium term outlook. We expect the pair to remain volatile, with scope for a recovery towards the 200 day SMA near 159 if oversold conditions unwind, while a break below 156.10 would expose the 155.00 area.
GBP / USD
Source: Massive (polygon.io)
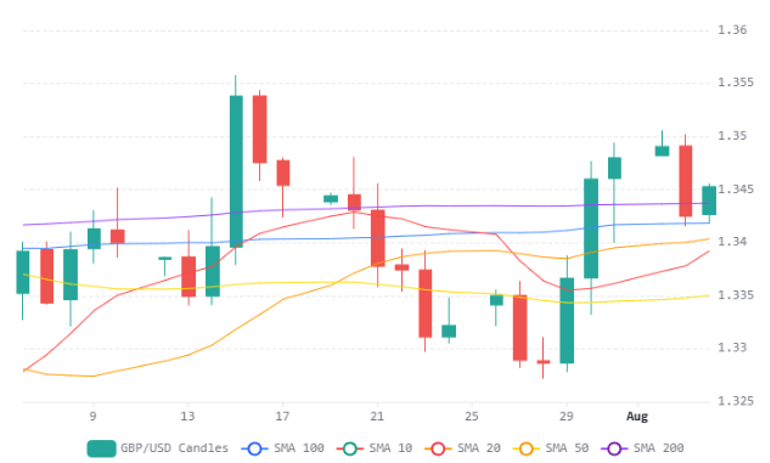
GBP/USD is trading around 1.3453, sitting close to an important technical confluence where the 20 day, 50 day and 200 day SMAs converge around the 1.3400 area. The rising 30 day VWAP continues to support the broader recovery, while recent price action suggests buyers remain in control following the advance from last week's lows.
The fundamental backdrop has become more supportive for sterling. Softer US economic data, including weaker JOLTS job openings and factory orders, has encouraged markets to moderate expectations for further Federal Reserve tightening, while falling oil prices following progress in US Iran negotiations have reduced inflation concerns and weighed on the dollar. At the same time, the Bank of England's relatively hawkish stance continues to provide support for sterling.
We see resistance around 1.3525 as the next key upside level, with a sustained move above this area opening the way towards the recent high near 1.3550. On the downside, renewed dollar strength following Friday's payrolls report could trigger a pullback towards support around 1.3330, particularly if US labour market data proves stronger than expected.
Economic Calendar



