


Summary
The first half of 2026 was dominated by geopolitical risk, inflation concerns and shifting monetary policy expectations. As we move into H2, many of those themes remain relevant, but the market focus has become more nuanced. Investors are no longer reacting to events themselves, but to the way they influence energy prices, inflation, and ultimately policy expectations. The result is an increasingly uneven backdrop across commodity markets. Across base metals, this has produced a more selective environment in which individual supply-demand dynamics, positioning and sector-specific demand trends are playing a larger role in price formation than broad macro sentiment alone.
Aluminium
Aluminium has moved from a disruption-led rally into a supported range. Al Taweelah’s restart and record Chinese exports have reduced shortage risk, but Gulf supply is not fully normalised and inventories remain low. We see fair value around $3,050–3,200/t, with dips supported and rallies above $3,200/t likely capped.
Copper
Copper remains supported by tariff uncertainty and the COMEX-LME dislocation, leaving policy developments as the key near-term driver. We expect copper to remain resilient through Q3, with mean-reversion strategies likely keeping prices anchored around $13,500/t through the end of the summer. Tariff headlines should continue to create periods of volatility and upside spikes, but are unlikely to generate a sustained directional trend.
Lead
Lead enters Q3 on firmer footing following June's liquidation, with downside pressure fading. Cleaner positioning and signs of seller exhaustion create scope for a technical recovery. We see potential for a move towards $1,950/t, with $2,050/t likely to represent stronger resistance.
Nickel
Nickel has stabilised after the June correction, supported by tighter Indonesian ore policy and elevated HPAL input costs. However, demand remains soft and the market still lacks confirmation of a sustained squeeze. We expect prices to trade broadly within $16,500–18,000/t into late September, with rallies capped near the upper range.
Tin
Tin remains supported by persistent physical tightness despite the June correction. Visible inventories have not rebuilt meaningfully, while Indonesian export constraints and Myanmar’s gradual restart continue to limit supply relief. We expect prices to remain elevated but volatile, trading mainly within $50,000–55,000/t into late September.
Zinc
While underlying fundamentals remain constructive, increasingly stretched positioning leaves zinc vulnerable to periods of sharper correction. We expect elevated volatility through Q3, with $3,300/t remaining a realistic downside target under a positioning normalisation scenario.
Iron Ore & Steel
Iron ore has remained more resilient than underlying steel fundamentals would suggest. However, elevated inventories, improving seaborne supply and weak steel-sector profitability should continue to limit upside. We expect iron ore to remain broadly rangebound within a $90-100/t range through Q3.
Gold
Gold remains historically elevated despite the sharp correction from January highs. Central bank buying continues to provide a floor, but firm real yields, a stronger dollar and a cautious Fed stance are limiting upside. We expect gold to consolidate within $3,950–4,300/oz into late September, with rallies above $4,200/oz likely capped.
Silver
Silver has corrected sharply from the Q1 highs, removing much of the earlier speculative premium. The physical deficit and light positioning should support dips, but elevated real yields, a firm dollar and cautious Fed policy limit upside. We expect silver to remain rangebound within $56–66/oz into late September.
Platinum & Palladium
Platinum remains the stronger PGM, supported by a 297koz deficit, constrained supply and low inventory cover. Palladium’s recovery looks more tactical, with short-covering and supply-risk headlines offset by weaker auto demand and improving recycling. We expect platinum to trade within $1,520–1,780/oz and palladium within $1,150–1,420/oz.
Key Drivers
- Base metals without the war premium: The immediate conflict premium has largely been removed, but supply chains have not fully normalised. The disruption now looks less like a direct production-loss story and more like a reshuffle across cargo flows, procurement patterns and regional logistics, leaving aluminium and oil exposed to short-lived bottlenecks if headlines re-emerge.
- Summer lull, thinner liquidity and choppy trade: The summer slowdown has been amplified by the removal of conflict risk from prices and positioning, with volatility taken out aggressively and overnight moves becoming more choppy. Momentum is likely to become more reliable into September and October as liquidity returns, seasonal demand signals become clearer and participants rebuild exposure.
- Macro risk — Fed path driving the dollar: Our Fed view remains higher-for-longer, with rates expected to stay at 3.5–3.75% through late 2026 and only a small risk of one additional 25bp hike if inflation proves sticky. For metals, dollar upside looks capped unless incoming data force another hawkish reset, while softer CPI and labour data should allow a controlled drift lower and provide some relief.
- What this means for Q3: The market has moved past the immediate conflict trade, but it has not moved into a clean fundamental regime either. Price action is likely to remain headline-sensitive and uneven through the summer, with stronger directional conviction more likely to return once liquidity, macro data and seasonal demand signals become clearer.
Macroeconomic Outlook
World
As we move into the second half of the year, investors are seen transitioning away from a geopolitical shock-driven market towards a macro-driven one. While markets remain sensitive to developments in the Middle East, investors are increasingly focused on the secondary effects of the conflict rather than the conflict itself. Financial markets have become noticeably more comfortable looking through geopolitical headlines unless they threaten physical supply flows. The result is a world economy that has proven more resilient than expected, but where growth, inflation and policy expectations remain vulnerable to renewed energy price shocks.
In our view, the more important shift is taking place beneath the surface. Growth is becoming increasingly uneven across regions and sectors. The US continues to benefit from relatively resilient activity, China remains reliant on manufacturing, exports and technology rather than domestic demand, while Europe faces a more difficult balance between inflation and growth. At the same time, the AI investment cycle is emerging as a major source of support for economies integrated into the global technology supply chain, helping offset some of the drag from higher energy costs and weaker trade activity.
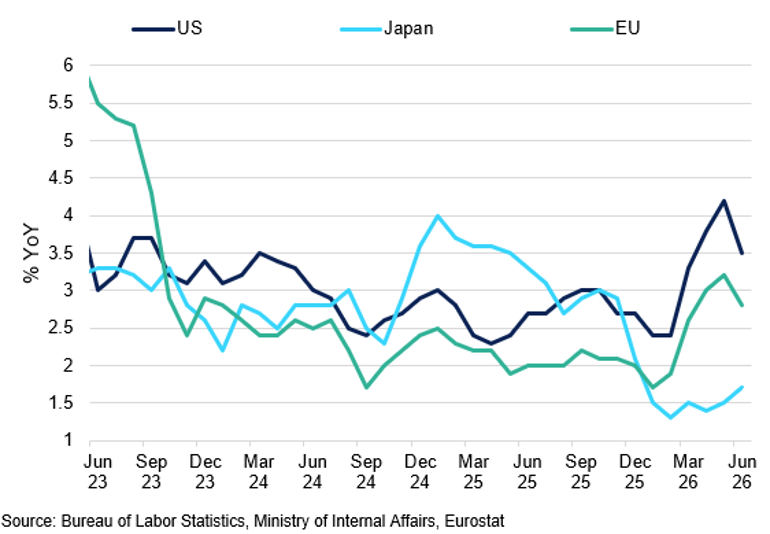
Major Economies CPI
After the initial energy price spike, inflationary pressures subsided but remain vulnerable to another sustained oil shock.
For commodities, this creates a more selective environment than earlier in the year. Broad-based macro momentum remains limited, but structural themes such as electrification and AI infrastructure investment continue to support demand in specific markets. As a result, we expect volatility to pick up once again, with markets increasingly reacting to inflation, growth and policy developments rather than geopolitical headlines alone.
US
The US macro narrative has shifted considerably over recent months. Markets are no longer primarily focused on geopolitical developments themselves, but on whether those developments can alter the outlook for inflation and monetary policy. While renewed tensions in the Middle East pushed Brent back above $95/bbl, the broader market response has been noticeably more restrained than earlier in the year. Investors increasingly appear willing to look through geopolitical headlines unless they directly threaten consumers. Rather than pricing a significant supply-chain shock, markets remain focused on the risk that higher energy prices could slow the earlier disinflation process and keep central banks cautious for longer.
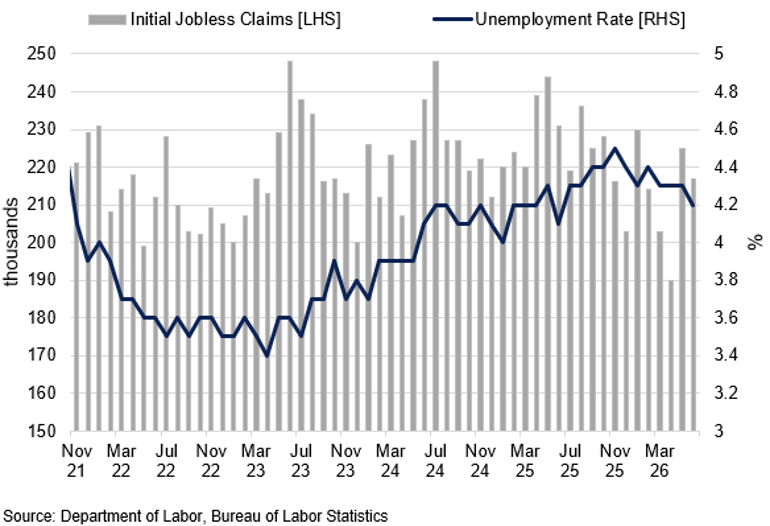
That sensitivity is particularly important because the US economy continues to show enough resilience to support a broadly hawkish policy backdrop. Labour market conditions have softened, with ADP employment growth slowing to 98k against expectations of 118k and June non-farm payrolls rising by just 57k in June. However, the broader message from recent data remains one of moderation rather than weakness. Q1 GDP growth was 2.1% annualised by the BEA, while the Fed's still placed 2026 growth near 2.2% and June unemployment remained relatively low at 4.2%. More importantly, stronger retail sales, resilient activity indicators and still-firm labour market conditions have repeatedly supported Treasury yields and prevented markets from fully abandoning the higher-for-longer narrative.
US Initial Jobless Claims vs Unemployment Rate
Both initial claims and unemployment fell, indicating improving labour conditions and giving the Fed breathing room to keep rates higher for longer if necessary.
Inflation remains at the centre of that debate. CPI softened to 3.5% in June, according to the BLS, marking another step towards a less hawkish policy. We view the latest inflation data as supportive for risk assets and precious metals, but not sufficiently weak to fully reverse the higher-for-longer narrative. While broader inflation pressures continue to ease, renewed strength in oil prices continues to create the risk of periodic upside surprises. From the Fed's perspective, inflation is moving in the right direction but remains too high to justify a more accommodative policy stance.
This dynamic has become even more pronounced under Kevin Warsh. With less emphasis on forward guidance, markets are increasingly forced to trade incoming data directly, leaving CPI, payrolls and labour market indicators exerting a greater influence on yields, the dollar and broader risk sentiment. Our base case remains that rates hold at 3.50%-3.75% through late 2026, with only a small risk of one additional hike if inflation proves stickier than expected. For the dollar, we believe that much of the hawkish repricing has already occurred. While the absence of near-term cuts should continue to provide support, further gains will likely require another hawkish reset driven by stronger labour market data, renewed inflation pressure or consistently higher energy prices.
EU
The euro area's outlook has become considerably less clear-cut than it appeared following the ECB's June rate hike. The initial decision was driven largely by the sharp rise in energy prices following the escalation of the Iran conflict, with policymakers concerned that persistently higher oil prices could eventually feed through into broader inflation pressures via food, services and wages. At the time, markets rapidly moved to price a more sustained tightening cycle, anticipating that the ECB would need to respond aggressively if the energy shock proved persistent.
While Eurostat confirmed that euro-area inflation surprised to the downside in June, falling to 2.8% from 3.2%, we are less convinced that the ECB has fully moved beyond the energy story. The recent decline in inflation was helped significantly by lower oil prices following expectations of a US-Iran agreement, but the recent rebound in energy prices challenges the idea of a smooth disinflation path through H2. The key question for the ECB is no longer whether inflation is falling, but whether it can continue falling at the same pace if energy remains elevated.
ZEW Growth Expectations vs Inflation Expectations
After oil price pressures subsided, markets became more hopeful on growth expectations, but this relief could prove temporary.
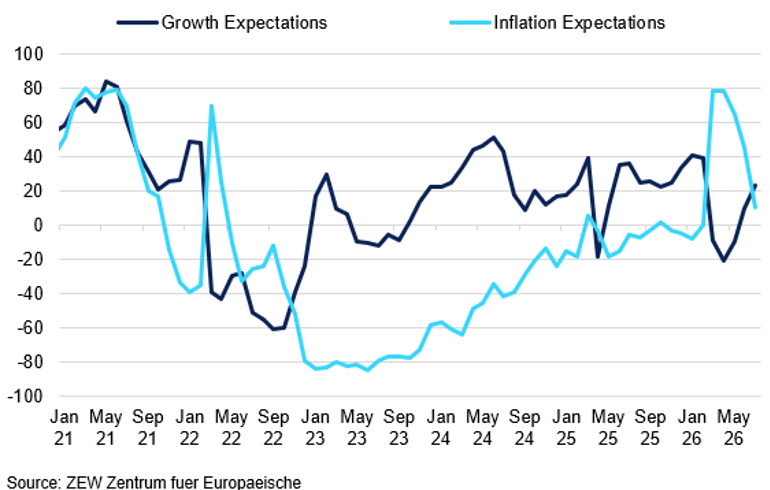
At the same time, the growth picture is proving more resilient than many anticipated earlier in the year, though far from robust. Euro-area manufacturing has remained in expansion territory for five consecutive months, with the manufacturing PMI at 51.4 in June and output rising for a sixth successive month. German exports rose 0.9% MoM and 6.1% YoY, according to Destatis in May, supported by stronger shipments to both the US and China. However, broader activity remains subdued. Industrial production declined 0.2% MoM in May, according to Eurostat, while retail sales increased just 0.2%, and the composite PMI remained below 50 at 49.5, consistent with an economy that is closer to stagnation than acceleration.
This leaves the ECB facing a more complicated trade-off than markets are currently pricing. Economic activity has been resilient enough to avoid renewed policy support, but growth remains too modest to comfortably absorb a prolonged tightening cycle, particularly if higher energy costs begin to weigh on household spending and industrial competitiveness. This is reflected in recent ECB communication, with Christine Lagarde noting that risks to inflation and growth have become more balanced, while Governing Council member Martins Kazaks argued that the urgency for consecutive rate hikes has "decreased significantly".
Markets continue to price close to two additional ECB hikes by year-end. We believe that is overly aggressive. One further hike remains plausible should energy prices remain elevated and inflation stabilise above target, but the combination of moderating inflation, mixed activity data and only modest growth momentum argues against a more sustained tightening cycle. In our view, the ECB is closer to the end of this cycle, though renewed energy inflation means policymakers are unlikely to declare victory just yet.
China
China's economy remains characterised by a growing divergence between a resilient external sector and subdued domestic demand. Official NBS data showed Q2 GDP growth slowing to 4.3% year-on-year from 5.0% in Q1, marking the weakest pace of expansion in more than three years. However, the slowdown was concentrated in the domestic economy rather than trade or manufacturing. Industrial production accelerated to 5.3% YoY in June, while exports continued to outperform expectations. By contrast, retail sales rose just 1.0% and fixed-asset investment remained in contractionary territory, highlighting the continued drag from weak property activity and softer consumer demand.
China’s Economic Performance
As industrial and retail sectors of the economy remain resilient, private investment continues to reach new lows, highlighting the uneven nature of China’s growth.
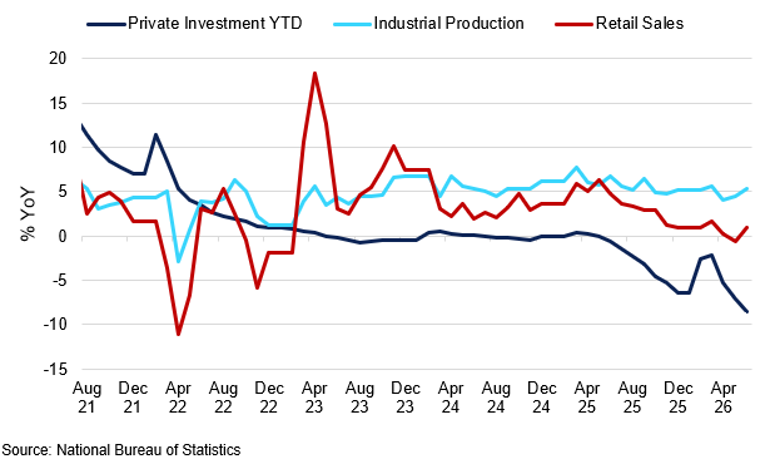
This increasingly suggests that China is relying on technology and exports rather than property and infrastructure to support growth. The country's trade surplus approached $1.2 trillion in 2025 and remains a key source of resilience, supported by strong demand for higher-value manufacturing, semiconductors and technology-related exports. This strength has also been reflected in the yuan, which has appreciated more than 9% against the US dollar since the 2025 tariff shock. Rather than simply reflecting dollar weakness, CNH performance points to improving confidence in China's external sector and its ability to absorb external shocks.
Technology has become an increasingly important pillar of that story. China's AI sector has emerged as a key source of investor optimism, although recent volatility highlights the risks of a market increasingly driven by expectations. The sharp July sell-off in global AI and semiconductor stocks reflected growing concerns around stretched AI valuations and the sustainability of investment spending. While the subsequent rebound suggests investors continue to view AI as a strategic growth theme, it also highlights the sector's sensitivity to shifts in sentiment and questions around the longer-term return on AI investment.
Our view remains that China is unlikely to deliver a significant cyclical acceleration in the near term. However, resilient exports, continued strength in manufacturing and technology, and improving confidence in Chinese assets should help stabilise growth through H2.
Oil
Oil has moved out of the panic phase, but not into a fully normalised market. Brent has fallen back below $90/bbl after the US and Iran paused attacks, removing part of the immediate Hormuz risk premium, although shipping risk has not disappeared and there is still no formal settlement.
Into late September, the key driver will be whether recovering physical flows outpace seasonal demand. Gulf supply has started to rebound as transit through the Strait of Hormuz improves, while global inventories have begun to stabilise after earlier draws. This reduces the risk of another sustained spike unless the conflict re-escalates. However, OECD stocks remain low and product markets are still tight, which should limit the downside and keep Brent supported on pull-backs.
Our base case is for Brent to hold a broad $78–92/bbl range into late September. The high-$70s should remain well supported while inventories are tight and refinery demand improves, but a move back above $90/bbl will need a renewed disruption risk. For now, the market has removed the panic premium, but not the geopolitical risk.
Aluminium
Key Points
- Geopolitical premium has faded, but low inventories and firm physical premiums should keep aluminium supported on dips.
- Al Taweelah’s restart and record Chinese exports have eased shortage risk, but Gulf supply is not yet fully normalised.
- We see aluminium rangebound around $3,050–3,200/t into late September, with a firm floor but limited upside conviction.
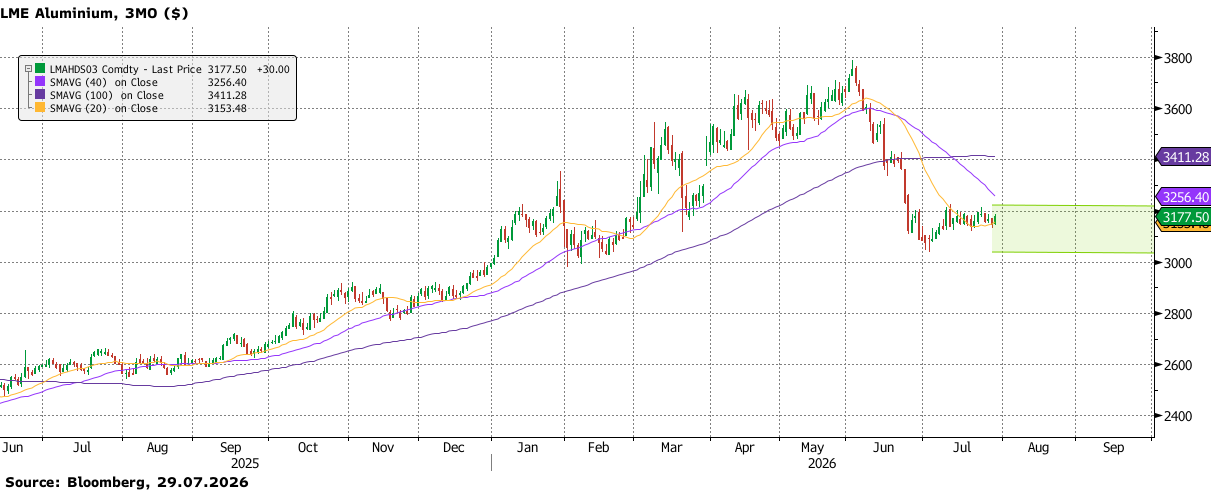
As of late July, aluminium has given back most of the premium built during the US-Iran shock. The market is no longer pricing an escalating disruption to Middle East supply, and LME prices have settled into a range, repeatedly failing near the $3,190/t area and remaining capped by the 200-day moving average. The move reflects a loss of upside momentum, while the underlying physical balance remains firm. The geopolitical shock has faded, but tight physical availability, low visible inventories and slower replacement flows are still providing support on dips.
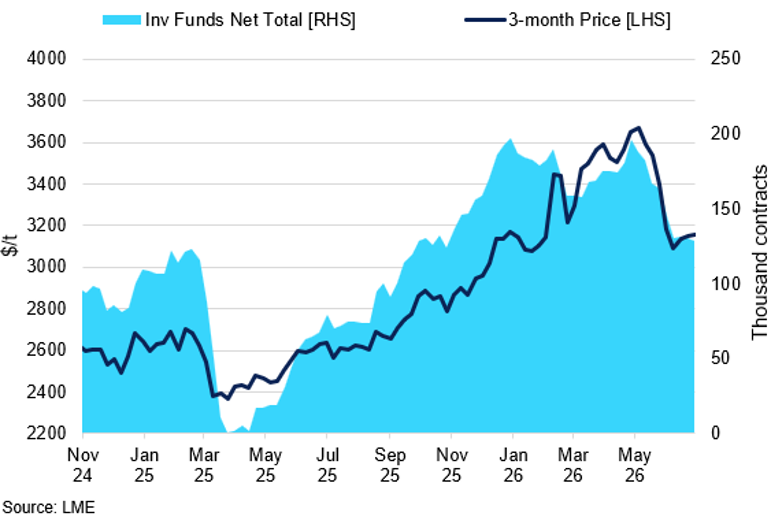
LME COT Investment Fund Net Total vs 3-Month Price
Fund length has unwound, leaving aluminium with limited upside conviction.
Supply conditions are improving, but the market is not yet fully normalised. The most important development is the restart of EGA’s Al Taweelah alumina refinery after a multi-month outage, with output expected to recover to around 50% of capacity in the near term and return to full technical capacity only by year-end. The smelter recovery is likely to be more gradual, as only a small share of pots has returned so far and the process of bringing cells back into stable operation takes time. As a result, the restart should not be viewed as an immediate return to pre-disruption supply. Middle East metal is beginning to re-enter the market, but several months of reduced availability and Gulf-related logistics risk still need to be reflected in prices.
The supply response has come less from a full Middle East recovery and more from a shift in trade flows. China has helped cushion the disruption more visibly into June, with exports of unwrought aluminium and aluminium products reaching a record 711kt, up 12.5% MoM and 45.4% YoY, taking first-half shipments to around 3.4Mt. This has reduced the risk of an acute shortage, but Chinese metal is not a direct replacement for Gulf units. It is further from Western consumers, slower to place into Europe or Japan, and more exposed to freight, carbon and policy frictions. Chinese flows can ease the immediate squeeze, but they do not restore the same nearby availability that Gulf exports provided before the conflict.
Positioning also points to a market that has moved away from the earlier upside shock scenario. Investment funds have reduced their net length, with the net position now around 0.131M, close to levels last seen in November, when aluminium was trading nearer $2,900/t. This suggests the market is no longer positioned for an open-ended rally. Options structures also appear to have shifted towards more capped-upside exposure, with traders still seeking protection against further gains but no longer pricing the same aggressive upside risk seen earlier in the conflict. This reduces the risk of further long liquidation compared with June, but it also means any sustained move higher will require fresh conviction.
Q3 Outlook:
Our base case into late September is for aluminium to remain supported, but rangebound. The earlier upside shock scenario has faded as Al Taweelah restarts and Chinese exports help offset part of the Middle East disruption. However, inventories remain low, regional premiums are still firm, and Gulf supply has not fully normalised. We therefore see fair value around $3,050–3,200/t into late September. Dips towards the lower end of the range should remain supported by low inventories and still-firm physical premiums, while rallies above $3,200/t are likely to face resistance as the earlier disruption premium fades. Aluminium should trade with a firm floor, but limited upside conviction unless supply risks re-emerge.
Copper
Key points
- Copper remains structurally supported, with the near-term sentiment driven by policy- and positioning-led management.
- US tariff risk and COMEX-LME dislocation remain the clearest catalysts, with metal already stockpiled in the US likely to stay less responsive to normal arbitrage signals while policy remains uncertain.
- We expect copper to stay supported on dips, but sustained upside requires either renewed tariff escalation or a fresh supply disruption.
Copper enters Q3 with a more balanced, but still constructive, setup. The metal is no longer trading with the same conflict-driven risk premium that dominated earlier in the year, and intraday reactions to macro headlines have become less directional than during the peak of volatility. This shifts the market into a more selective regime, where policy and positioning are likely to matter more than broad macro alone.
The main near-term driver remains the US tariff review and the associated COMEX-LME dislocation. Front-loaded shipments have already moved 700,000 tonnes of copper into the US, and while some of this metal could theoretically return to the global market if tariff expectations fade, the practical incentive to release it is limited while policy risk remains unresolved. In this sense, US inventories are increasingly treated as strategic or policy-sensitive stocks rather than metal that can move quickly back into the global pool whenever the spread narrows.
That distinction is important for price direction. A copper-specific tariff would likely keep COMEX supported and maintain a structurally wider premium versus LME, but the marginal upside may be more limited if the current arbitrage has already priced in a large part of the tariff risk. In the case of a tariff delay, the reaction would be less about a fresh disorderly move and more about where tightness migrates along the curve. LME spreads could tighten further out as the market prices continued flows into the US, while the front-end remains vulnerable to temporary easing if physical availability improves outside the US.
US Copper Tariff Outcome Scenarios and Implications
| Scenario | Market impact | Expected Market Implications |
| Tariff escalation or renewed protectionist rhetoric | COMEX and LME remains supported, the arbitrage premium stays structurally wide, and US-held metal remains difficult to release back into the global market. | Focus on spread behaviour and signs of renewed US inflows. |
| Delayed or watered-down tariff outcome | The nearby arbitrage compresses, inflows into the US slow, and part of the policy premium comes out of the market, although US stocks are likely to start rebuilding again closer to the new deadline. | We expect a tactical pullback in the nearby, but tightness further down the curve, especially in the event of delayed tariffs. |
| Tariffs rejected outright | The most bearish near-term outcome, as stockpiling incentives fade and metal becomes more freely available to the global market. | Risk of a sharper correction, with the market likely to test lower support before structural buyers return. |
Source: Sucden Financial
The structural story remains intact: mine supply is still vulnerable, concentrate availability remains tight, and low treatment and refining charges continue to highlight pressure further upstream. At the same time, the market has already priced a large portion of that long-term deficit narrative. Without a fresh catalyst, copper is likely to remain well supported but not aggressively bid, particularly if summer liquidity keeps participation thinner and headline-driven moves fade quickly.
Q3 Outlook:
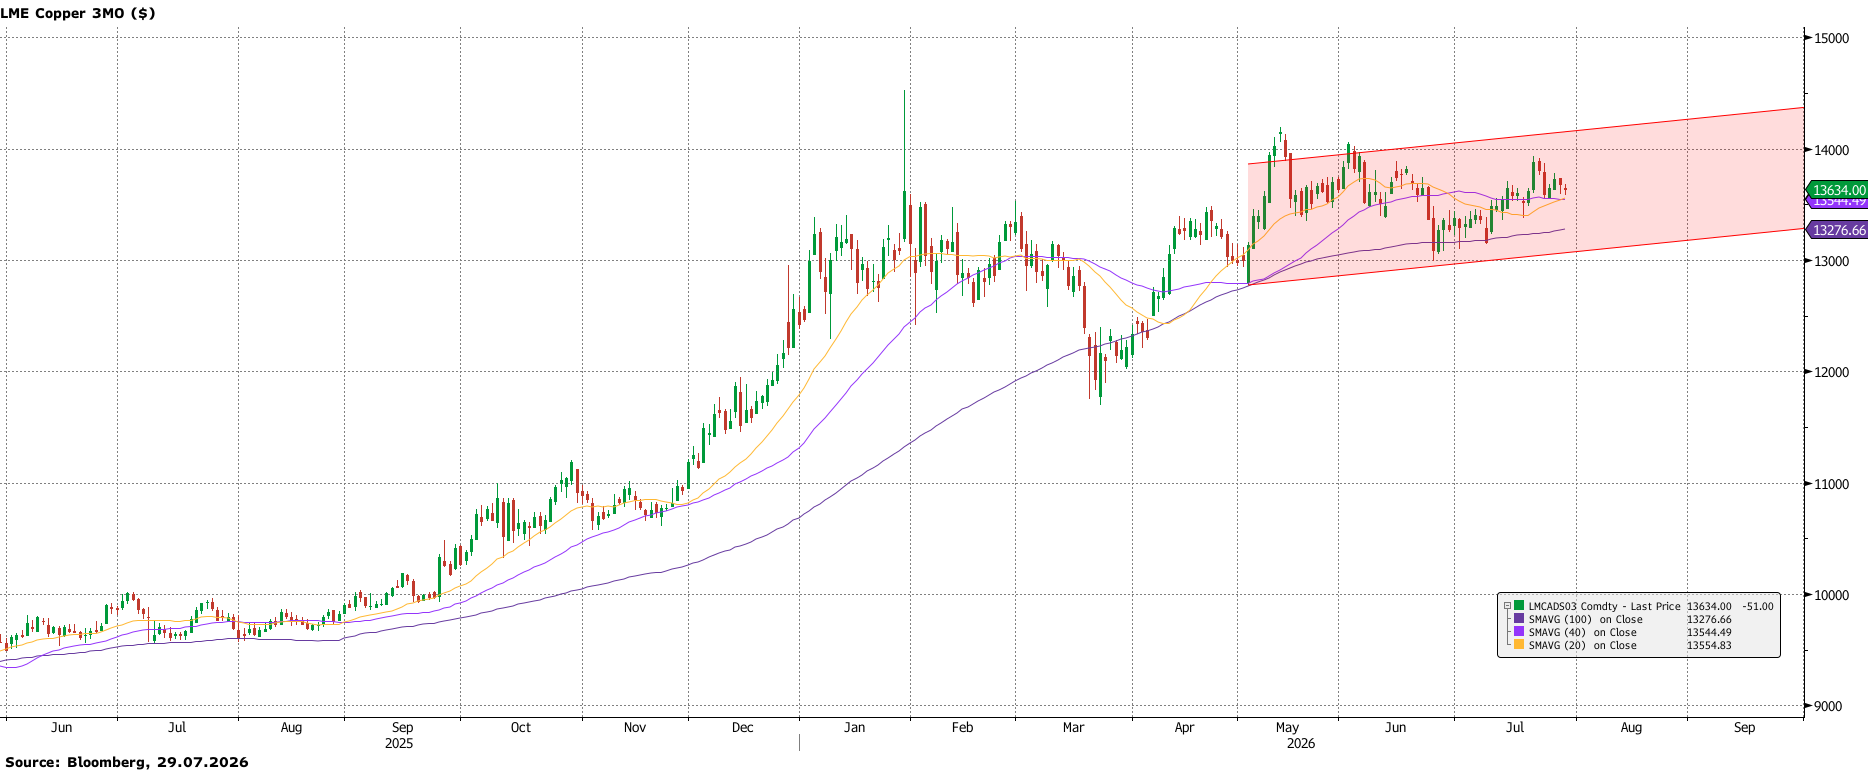
We believe copper looks more attractive as a range-trading around $13,500/t with a more bullish tilt and event-risk market. We expect copper to stay supported on dips into well-defined support, particularly if positioning has already reduced and physical indicators remain firm. Conversely, a failure of the tariff narrative would likely trigger a faster correction, but we would expect structural demand and supply tightness to limit the depth of the move. Overall, copper is likely to remain resilient, with policy headlines creating sharp but potentially short-lived opportunities.
Lead
Key points
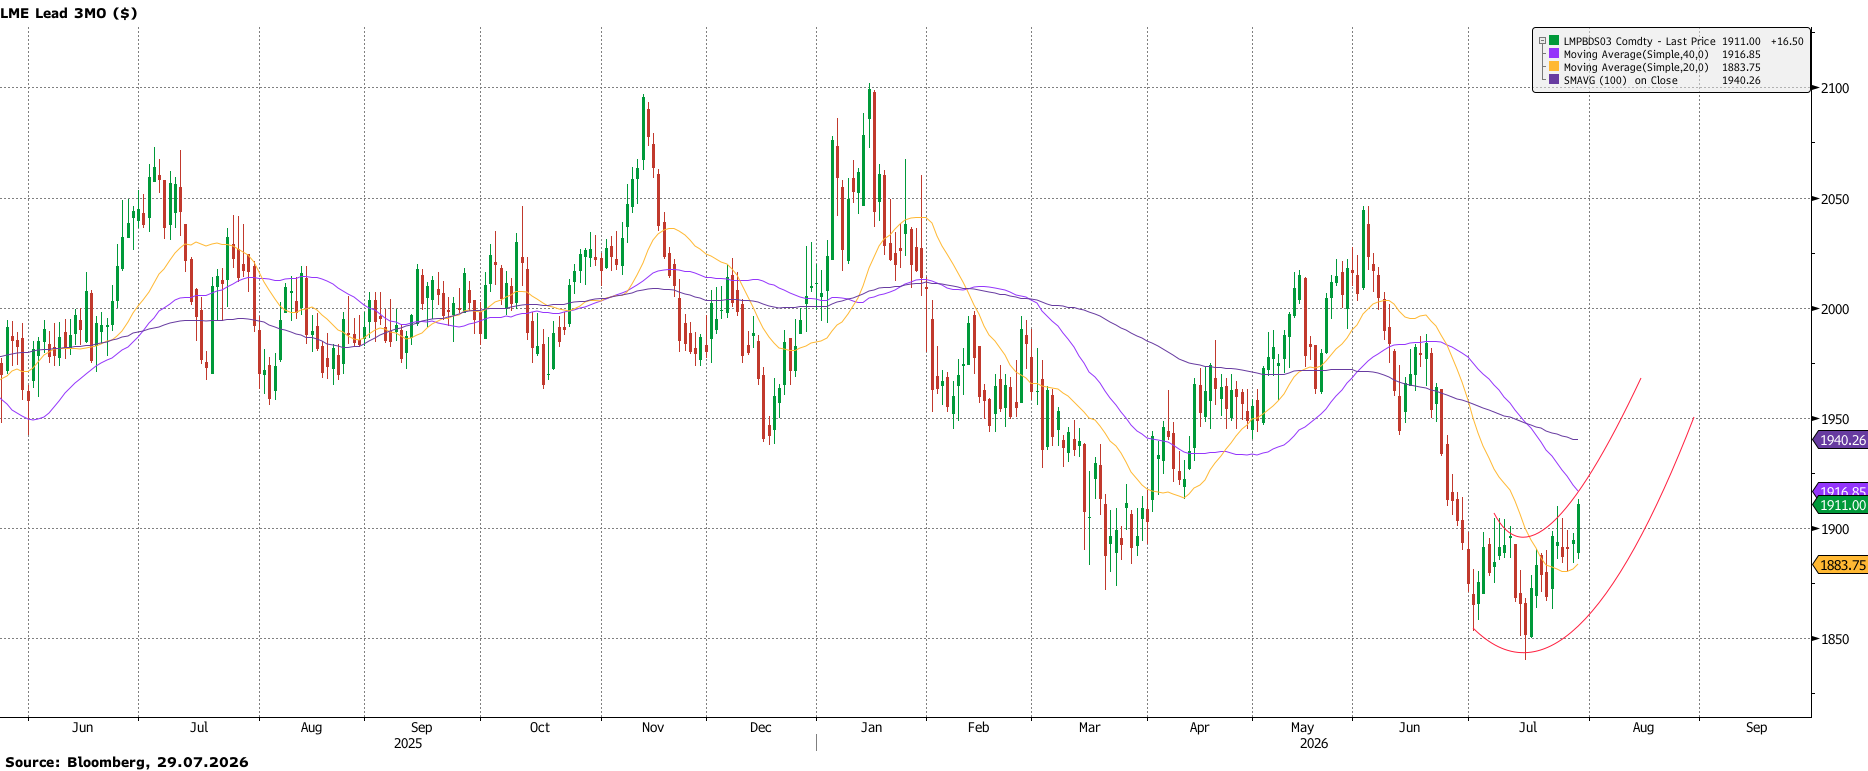
- Lead looks prone to a temporary rebound after the June liquidation, with the $1,840–1,850/t area now acting as a clearer support zone.
- The inventory build and wider contango have not generated much additional price downside, suggesting the market may have run out of marginal sellers.
- We see scope for mean reversion towards $1,950/t, with a move towards $2,050/t requiring confirmation from tighter spreads, stabilising inventories and stronger participation.
Lead entered June under pressure alongside aluminium and nickel as the base-metals complex unwound the Middle East conflict premium. While this liquidation was broader and sentiment-driven, lead’s current setup appears to be shaped more by its own positioning, spread and inventory dynamics. The key point is that the market has already gone through a meaningful forced-selling phase, and the price response around the $1,840–1,850/t area suggests that downside momentum is beginning to meet more tangible support.
Positioning remains central to our view. Investment funds were the main source of pressure in June, with net exposure falling back towards -21,000, the March–April lows. Volume was concentrated on the downside, while the subsequent recovery has taken place on comparatively light participation. This does not necessarily imply an immediate reversal, as the bounce may persist once the dominant sellers have exhausted themselves. Meanwhile, investment/credit firms continued to increase net length and commercial undertakings became less short as funds sold, reflect a transfer of risk away from directional investors towards intermediaries and commercial participants. That shift should reduce the likelihood of another disorderly liquidation in the near term, but without renewed fund buying it is more likely to stabilise the market than drive a sustained growth beyond a technical rebound.
LME Lead Investment Fund Net Length vs Price
Net length turned short again as speculative players liquidated their positions.
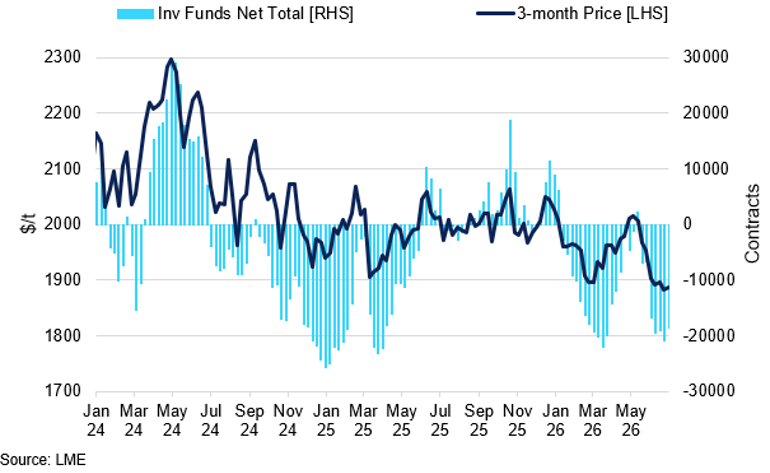
The physical picture is mixed, with the nearby spreads easing into contango. Subsequent rise of 180,000mt in LME stocks was not met with an aggressive leg lower, suggesting the market may be treating this as an inventory reshuffle or financing-driven move, rather than evidence of a sudden deterioration in end-demand. We believe that stocks are unlikely to be drawn down aggressively in the near term, but the fact that prices stabilised despite the build makes the $1,850/t area look more meaningful as a support zone.
The zinc-lead spread continues to widen as investors favour zinc over lead within the base-metals complex. While lead has cleared out majority of the sellers, zinc remains supported by concentrated investment-fund positioning. This leaves the relationship looking increasingly asymmetric: we see greater potential for spread narrowing via a correction in zinc than a sustained rerating of lead.
Q3 Outlook:
Our base case is therefore for a temporary technical rebound; lead’s oscillating price behaviour supports a mean-reversion setup, with $1,950/t as the first realistic target if dip-buying continues. A move beyond that would need better confirmation from the curve: tighter cash-to-three-month spreads, stabilising or falling inventories, and stronger participation on up-days. We would also pin Q3 resistance lower than the previous highs, with $2,050/t a more reasonable ceiling unless the physical picture retightens more clearly.
Nickel
Key Points
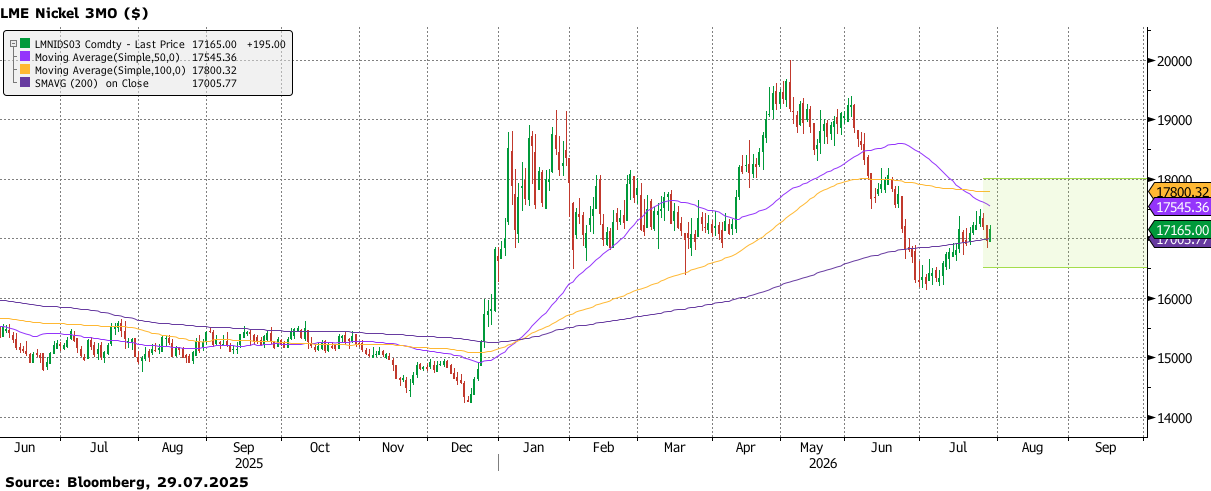
- Nickel has stabilised after the June sell-off, but the recovery still needs stronger follow-through above key moving averages.
- Indonesia’s tighter ore approvals and elevated HPAL input costs have strengthened the price floor.
- We see nickel rangebound at $16,500–18,000/t into late September, with supply discipline limiting downside but soft demand capping rallies.
As we approach August, nickel has stabilised after the sharp June correction, but the recovery remains tentative. LME prices have reclaimed the 200-day moving average and pushed back towards $17,500/t, suggesting that liquidation pressure has eased and buyers are beginning to return. However, the market has not yet cleared the next resistance band, with the 50-day and 100-day moving averages still above current prices. The technical picture has improved, but the move still needs stronger follow-through before a sustained uptrend can be confirmed.
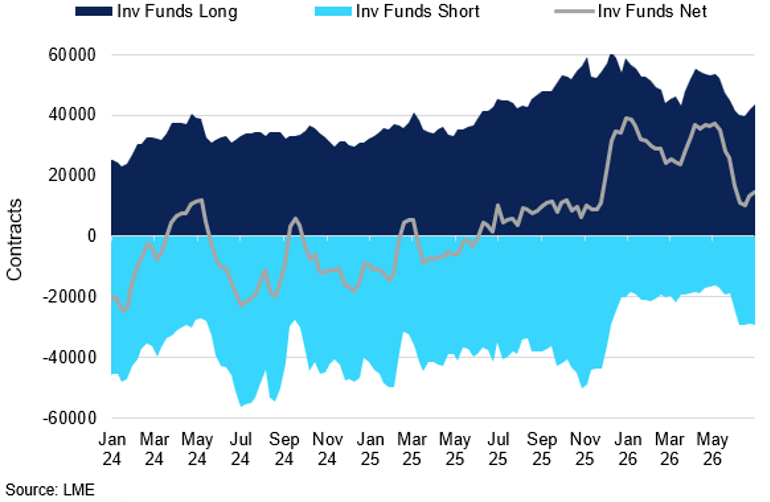
LME Nickel COT Investment Fund Positioning
Fund positioning has turned more cautious as the recovery struggles to extend beyond recent resistance.
Indonesia remains the decisive factor for nickel prices. The government has continued to manage ore supply through the RKAB framework, with 2026 approvals still materially below last year’s level. Current guidance points to national allowances around 250-270Mt, compared with 379Mt in 2025, while some producers have faced sharper individual cuts. Weda Bay, for example, has been referenced with a 2026 permit of around 12Mt versus 42Mt last year. This has tightened ore availability and reinforced the view that Jakarta is increasingly prepared to use supply policy to stabilise prices. The policy floor is therefore more credible than it was during the previous oversupply phase, although the risk of additional quota approvals means the upside is still politically constrained.
Sulphur availability adds another layer of support. The acute supply stress seen earlier in the year has eased as Middle Eastern logistics have improved and new acid capacity has started to enter the Indonesian market. Nickel Industries, for example, started up the sulphuric acid plant at its Excelsior Nickel Cobalt HPAL project in late June, with the project expected to hold enough inventory to cover initial consumption through Q3. This reduces the risk of an immediate shortage, but it does not fully remove cost pressure. Sulphur prices remain elevated, and Indonesian HPAL producers are still operating with a less predictable input base than before the disruption.
This matters because battery-grade nickel growth is increasingly tied to HPAL processing. Recent Indonesian industry reporting suggests the impact is already visible, with MHP output from Indonesian HPAL smelters falling to 29,900t Ni in June from 42,000t Ni in January. According to BMI, Indonesian hydrometallurgical nickel smelter production is expected to grow by only 3% YoY in 2026, well below the five-year average of 23.2%. Elevated acid costs and less reliable sulphur availability have made rapid HPAL expansion harder to assume, strengthening nickel’s support on price pullbacks.
Positioning reflects this lack of conviction. Investment funds have reduced net long exposure since May, while fresh shorts entered the market as advances towards $18,000/t struggled to attract follow-through buying. This suggests investors recognise the tighter Indonesian policy setting, but are not yet prepared to price a sustained physical squeeze. The market is no longer dominated by liquidation pressure, but it still lacks the demand confirmation and inventory drawdown needed for a decisive breakout. In practical terms, nickel is better supported than it was in early July, but the recovery remains vulnerable when prices approach the upper end of the recent range.
Q3 Outlook:
We expect nickel to remain supported into late September, but rangebound. Indonesian ore discipline has strengthened the market’s floor, while elevated HPAL input costs have reduced confidence in rapid supply growth. We therefore see prices trading broadly within a $16,500–18,000/t range. Downside should be limited by tighter Indonesian policy and higher processing costs, but soft demand and the remaining surplus are likely to cap rallies unless supply constraints become more visible.
Tin
Key Points
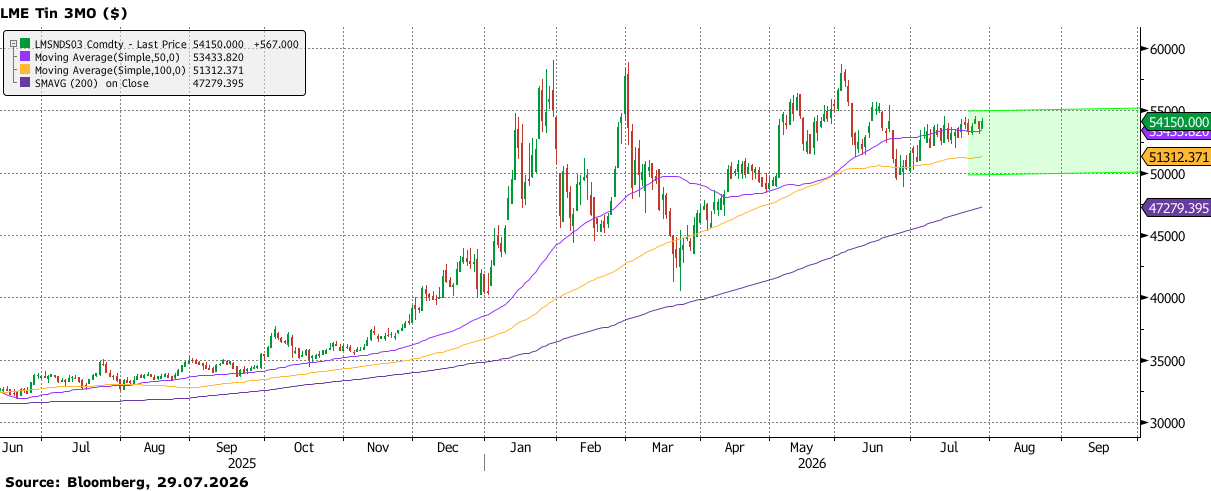
- Tin remains elevated but volatile, with the June washout reducing speculative momentum without rebuilding visible inventories.
- Indonesia’s export constraints and Myanmar’s gradual recovery continue to limit the supply response.
- We see tin trading mainly within $50,000–55,000/t into late September, with upside risk if inventories keep drawing.
As we approach August, tin remains one of the most elevated and volatile metals in the LME complex. Prices have had a strong year, rising from the low $30,000s/t into the low $50,000s/t, but the June washout from almost $59,000/t towards $49,000/t showed how quickly speculative momentum can reverse in a small and illiquid market. The stabilisation around $53,000/t is encouraging, although the market is still consolidating and has not yet rebuilt clear upside momentum. Buyers have returned after the liquidation, yet each bounce has found selling before the market could rebuild clear upside conviction.
LME Stocks vs Cancelled Warrants vs SHFE Deliverable Stocks
Visible inventories are tightening again, leaving tin exposed to renewed supply shocks.
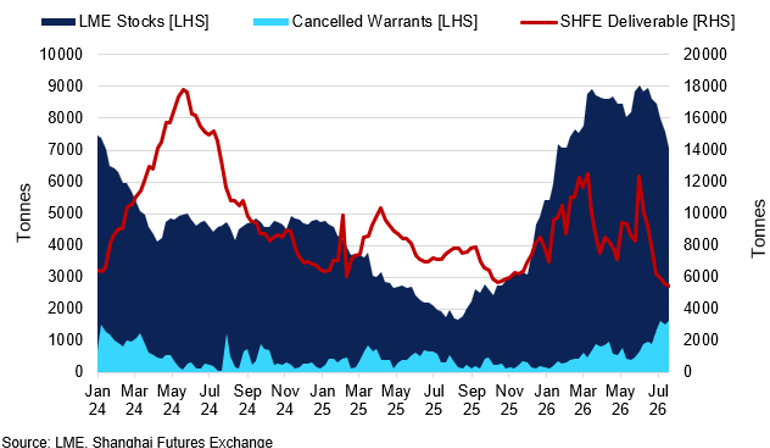
The correction has nevertheless exposed a key feature of the market. Despite the sharp decline in prices during June, visible availability has not rebuilt in any meaningful way. LME inventories have eased from their mid-June peak, cancelled warrants have moved higher into July, and SHFE deliverable stocks have fallen sharply from the early-June spike. Physical tightness has therefore persisted even as speculative momentum faded, leaving the market sensitive to any renewed disruption from major producing regions.
Supply remains the key support. Indonesia is not short of tin resources, but export permits, annual RKAB approvals, quota reviews and stricter enforcement against illegal mining continue to constrain the availability of metal outside the country. In the first half of this year, Indonesian tin ingot exports were only around 19,000 tonnes, down roughly a quarter year-on-year, while June shipments remained about a third below last year's level despite a month-on-month recovery. This highlights that the key risk is not resource depletion but regulatory control over production and exports. Until approval procedures become more predictable, Indonesian supply is likely to remain a source of uncertainty for the global market and an important support for prices.
Myanmar remains another source of uncertainty for the global tin balance. Mining activity in Wa State has resumed, but the restart at Man Maw is still gradual and operationally constrained. According to the International Tin Association, Wa authorities introduced a dewatering cost-sharing mechanism across 11 mine portals in March, reflecting the continued impact of flooding in the deeper, higher-grade workings. Export flows to China have improved, with customs data showing imports from Myanmar at around 6,600 tonnes of tin ore and concentrates in May and 6,400 tonnes in June. However, the slight decline in June suggests that the recovery has not yet built consistent momentum. Myanmar is therefore no longer a full outage risk, but it has also not provided the supply relief the market had expected. Combined with Indonesia’s export constraints, this limits the market’s ability to rebuild visible inventories and keeps the supply side supportive for prices into Q3.
Q3 Outlook:
Into late September, our base case is for tin to remain elevated but volatile, with prices broadly supported around the $50,000/t area. The June correction has reduced speculative momentum, but it has not been accompanied by a meaningful rebuild in visible availability. LME stocks have eased from their mid-June peak, cancelled warrants have moved higher, and SHFE deliverable stocks have fallen sharply, leaving the market with a thinner inventory cushion. At the same time, Indonesian export constraints and the gradual restart in Myanmar continue to limit the supply response. Our Q3 price view is for tin to trade mainly in a $50,000–55,000/t range, with upside risk if inventories continue to draw and supply flows from Indonesia or Myanmar disappoint.
Zinc
Key Points
- Zinc remains resilient, but prices appear increasingly supported by speculative positioning and paper-market momentum.
- The current COT positioning looks stretched, with investment funds heavily long, echoing the October-November 2024 setup.
- While fundamentals remain supportive, they are not sufficiently tight to fully explain current valuations.
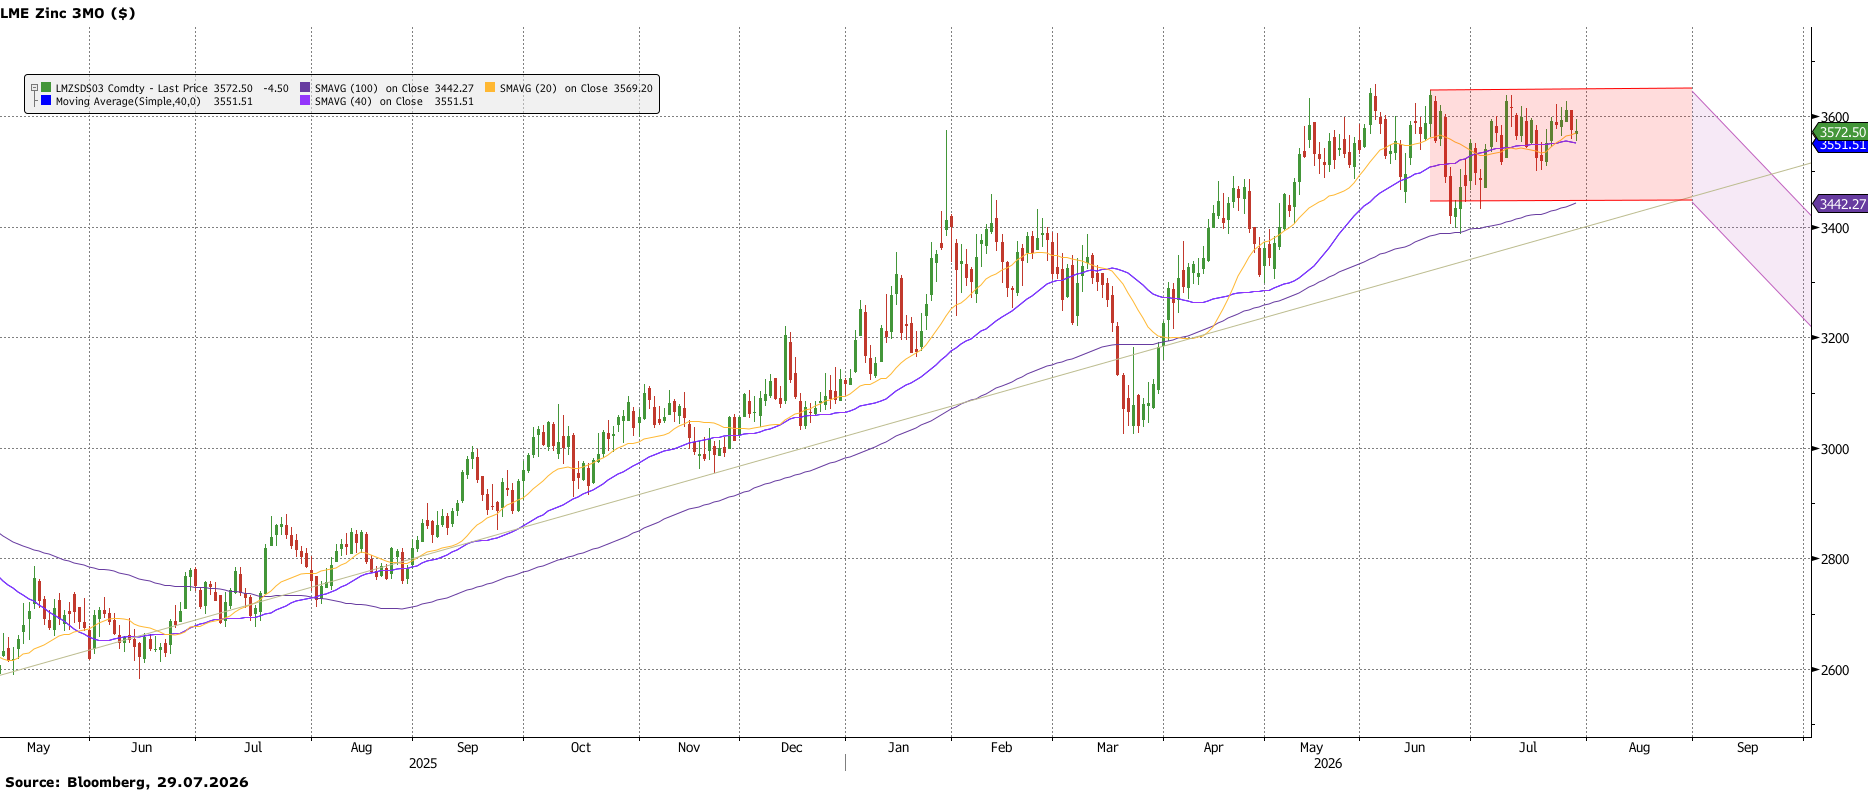
Zinc has held up considerably better than the physical market would normally imply. In previous episodes, an unwind in nearby spreads would have been enough to trigger a more decisive correction in outright prices. This time, however, the initial move lower was quickly absorbed, with the three-month contract recovering from the $3,500/t area. That resilience suggests the market is no longer being driven primarily by immediate scarcity signals. Instead, support has migrated towards the paper market, where investment funds remain willing to hold directional length and investors appear reluctant to establish fresh shorts while momentum remains intact.
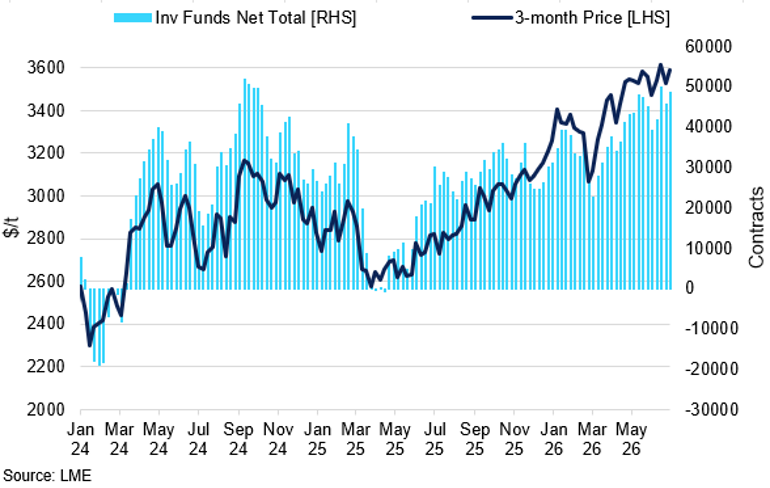
The positioning picture is therefore central to the zinc outlook. Investment funds are close to 50,000 lots net long, approaching levels last seen in October-November 2024, while investment/credit firms have moved into increasingly short territory. More importantly, investment-fund participation of total open interest has risen to nearly 30%, effectively doubling over the period. The important point is that this same broad COT configuration has reappeared at a price level roughly $1,000/t higher than the previous episode. In other words, the market is relying on a comparable amount of speculative participation to justify a significantly richer valuation than it did in late 2024. If investment funds are now the marginal price setter, zinc can remain firm for longer than fundamentals alone would justify, but it also becomes increasingly vulnerable once those flows begin to slow.
LME Zinc Investment Fund Net Length vs Price
Systematic funds continue to support prices, but this structure appears vulnerable to technical corrections.
Recent price action increasingly suggests zinc is decoupling from copper rather than trading alongside it. The rolling correlation between the two metals has fallen sharply and recently moved below zero for the first time in more than a year, highlighting a growing divergence in the drivers behind each market. While copper continues to draw support from structural deficit expectations, tariff uncertainty and persistent dip-buying interest, zinc appears increasingly reliant on investment-fund participation and positioning dynamics. The latest ILZSG forecast points to a refined zinc deficit of just 19kt in 2026, following a 33kt refined deficit reported earlier in the year. Those balances remain supportive and help explain why dips continue to attract buyers, but they are relatively modest in the context of a roughly 14Mt refined zinc market and struggle on their own to justify prices remaining close to multi-year highs.
At the same time, we see an increasing short building further down the curve, suggesting that the market is distinguishing between a resilient nearby market and a less convincing medium-term balance. Current deficits provide enough fundamental support to prevent a deeper correction, but they are not large enough to justify an indefinitely expanding speculative premium. Increasingly, physical tightness is preventing a collapse, while investment-fund participation is explaining the outperformance.
Q3 Outlook:
Our base case is for a plateau phase where the risk-reward is becoming progressively less attractive for new longs. However, the market is becoming more reliant on continued fund buying to sustain current valuations. We therefore expect elevated and choppy trade through Q3, with repeated attempts to break higher becoming harder to sustain. Once fund buying slows, downside asymmetry increases materially. Under a positioning-normalisation scenario, a move back towards $3,300/t would be a realistic correction target even without a significant deterioration in underlying demand.
Iron Ore & Steel
Key Points
- Iron ore remains more resilient than steel fundamentals imply, supported by blast furnace utilisation, strong import demand and declining domestic ore production.
- Inventories remain elevated, but the market is moving from oversupply towards balance.
- We remain tactically constructive but strategically cautious: resilient demand should support prices in the near term, but rising seaborne supply, weak mill profitability and the risk of further steel production cuts are likely to cap upside.
The iron ore market remains caught between a relatively resilient raw-material market and a deteriorating steel backdrop. On the demand side, China's property sector continues to struggle, fixed-asset investment fell 5.7% in H1, according to NBS data, while industry data put crude steel production down 3.0% YoY. At the same time, profitability among surveyed steel mills has deteriorated sharply. Rising finished steel inventories, weaker seasonal demand and narrowing margins are increasingly reinforcing expectations of further steel production cuts through H2.
China's June iron ore imports rose to 112.69Mt, a six-month high, while blast furnace utilisation remains close to 90% on industry surveys, suggesting mills have maintained production despite weaker profitability. At the same time, China's domestic iron ore production fell 7% year-on-year during H1, according to NBS data, increasing reliance on imported material. The result is a market where steel demand is soft, but iron ore consumption has held up better than expected.
China Iron Ore Stocks vs Iron Ore Price
Despite record-high China stocks, price support appears established at $95/mt.
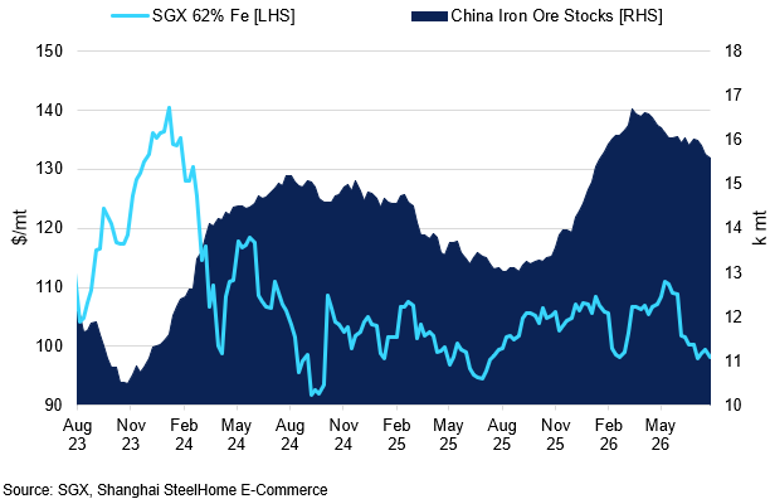
Inventories tell a similarly mixed story. Port stocks have fallen for three consecutive weeks to 170.65Mt, helping stabilise sentiment, but they remain elevated by historical standards and are still close to record levels for this time of year. This suggests the market is not facing a shortage of ore. Rather, inventories have stopped worsening, which has removed an important source of downward pressure on prices. At the same time, mills increasingly favour higher-grade material as rising coke costs encourage efficiency gains, helping support premiums for pellets and higher-quality ores even while total inventory levels remain high.
However, we believe the balance of risks still points lower rather than higher. Australian and Brazilian shipments have accelerated, Brazil's exports reached record highs in June and Vale reported its strongest second-quarter iron ore output since 2018. As attention shifts back towards weak steel margins, rising finished steel inventories and the prospect of further production cuts, the fundamental support for iron ore looks increasingly fragile.
Q3 Outlook:
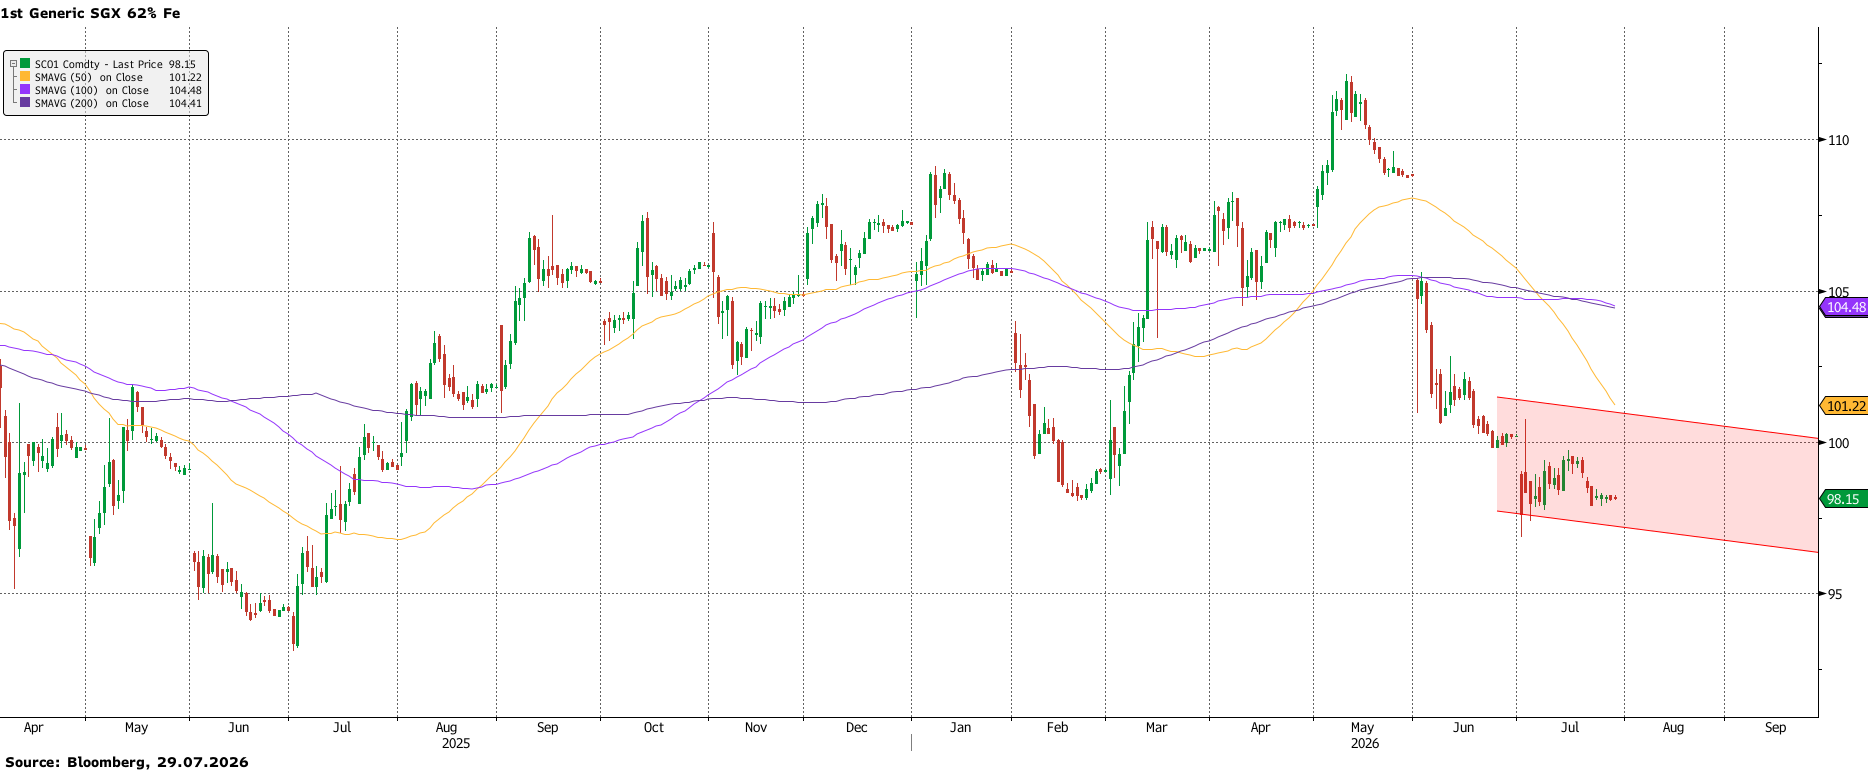
Our view remains that iron ore is better supported than steel demand alone would suggest, but the reasons for that support are becoming narrower. Resilient hot-metal production, domestic ore weakness and grade-specific tightness can continue to prevent a sharp collapse, yet elevated inventories, improving seaborne supply and deteriorating mill economics should cap upside, keeping prices within $90-100/mt range. As a result, we see limited scope for a sustained rally unless the steel market itself begins to improve, which currently appears unlikely.
Gold
Key Points
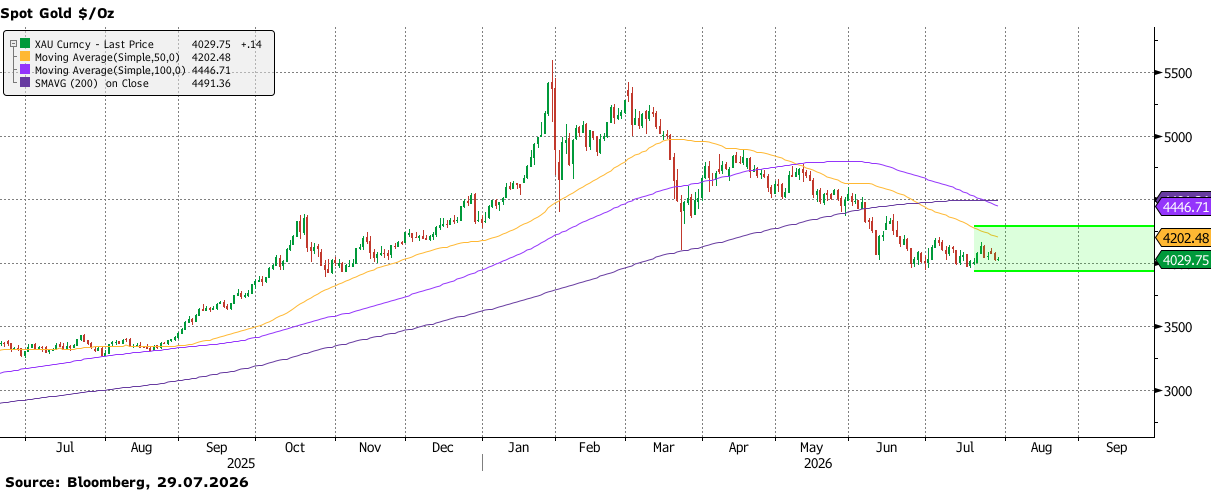
- Gold remains elevated despite the January correction, with valuations still rich versus real yields and the dollar.
- Firm US yields, sticky inflation risks and a cautious Fed should keep rallies capped into late September.
- Central bank buying should limit downside, but weaker ETF flows leave gold rangebound around $3,950–4,300/oz.
Gold remains elevated by historical standards, despite the sharp correction from the January peak. Prices have retreated by 25% from the high above $5,400/oz and are modestly negative year-to-date, but valuations remain rich relative to long-term averages. Even after the correction, gold continues to trade above levels that would typically be implied by real yields and the US dollar, suggesting much of the geopolitical and macro risk premium accumulated earlier in the year has not been fully removed.
Spot Gold vs US 10Yr Yield
Firm US yields have limited gold’s recovery from the January peak.
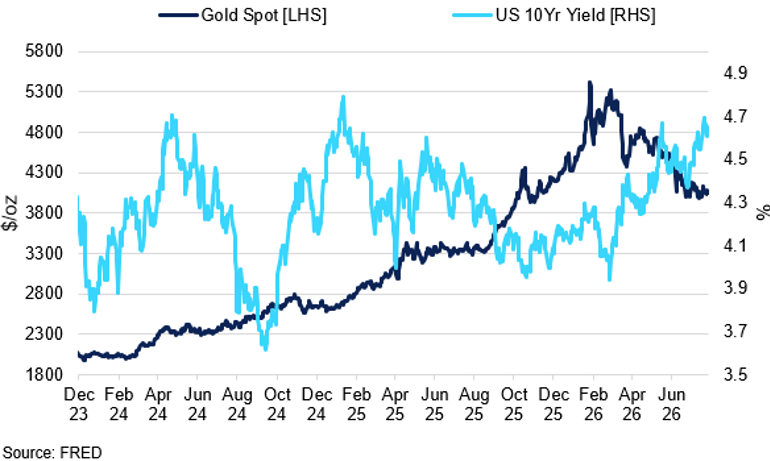
The macro environment has become less supportive for additional gains. US Treasury yields have remained firm, with the 10-year yield recently testing 4.7%, while inflation concerns have re-emerged alongside higher energy prices. Gold generally struggles when rising inflation expectations are accompanied by higher real yields, as the opportunity cost of holding a non-yielding asset increases. As a result, the market has found it difficult to establish a fresh upward trend, with price action increasingly characterised by range trading and lower highs since May.
Positioning reinforces the loss of momentum. COMEX net length has historically risen alongside gold, but that relationship has weakened this year, with price gains no longer matched by consistent additions to speculative exposure. Investors are therefore not rebuilding positions with the same conviction seen during the first-quarter rally, which leaves rallies more exposed to fading while real yields remain elevated.
Fed policy remains a key driver for gold. Under Chair Kevin Warsh, the Committee has repeatedly stressed that inflation remains its primary concern, even as growth momentum has slowed. Markets no longer expect the aggressive easing cycle that was priced earlier in the year, and we expect rates to remain unchanged through the near term. While this is not our base case, a further rate increase cannot be ruled out if energy-driven inflation pressures persist and labour market data remain resilient. This policy stance should keep real yields relatively well supported and limits the scope for a sustained recovery in gold prices before the end of Q3.
Official-sector demand continues to provide an important floor for gold, even as ETF flows have turned less supportive. World Gold Council data show central banks bought a net 41t in May, led by Poland and China, with Poland the largest reported buyer year-to-date at 64t and China extending its buying streak to 20 consecutive months. This steady accumulation has helped keep corrections orderly despite firmer real yields. By contrast, ETF demand weakened sharply in June, with global physically backed gold ETFs seeing $8.9bn of outflows and holdings falling by 74t to 4,047t. North America accounted for the largest decline at $5.5bn, as higher real yields, a stronger dollar and a more hawkish Fed reduced the appeal of holding non-yielding assets. Central banks therefore continue to cushion the downside, while ETF flows are unlikely to drive a new leg higher until the Fed path softens.
Q3 Outlook
We expect gold to remain supported into late September, but largely rangebound. Central bank demand should continue to limit downside pressure, while elevated real yields and a cautious Federal Reserve stance are likely to cap rallies. We therefore see gold consolidating within a broad $3,950-4,300/oz range through late September. Dips towards the lower end of the range should continue to attract buying interest, while gains above $4,200/oz are likely to struggle for follow-through until Fed’s policy becomes dovish.
Silver
Key Points
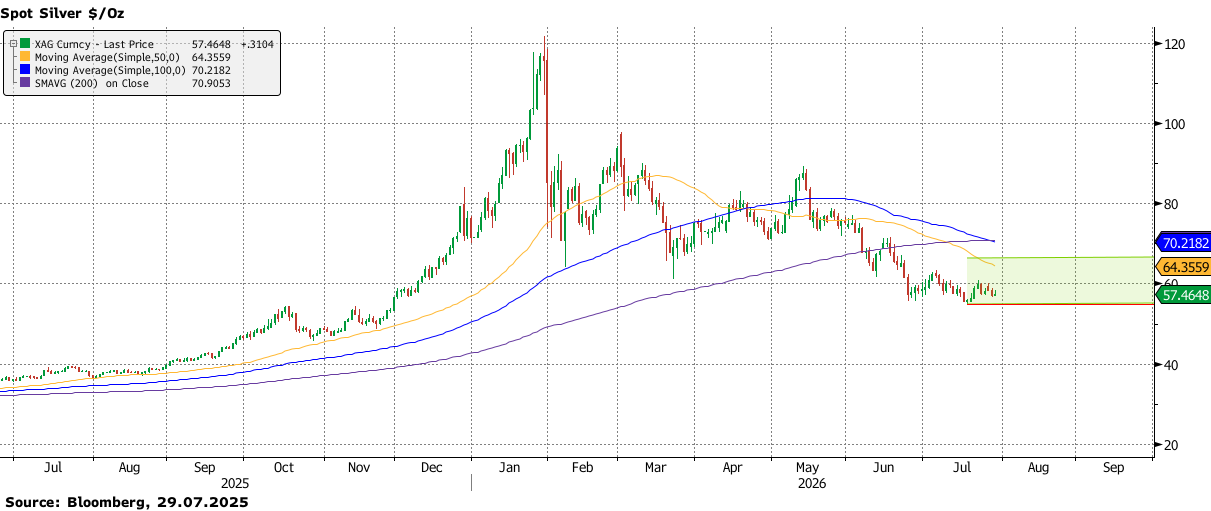
- Silver has unwound most of its Q1 premium, but the longer-term supply-demand picture remains constructive.
- Elevated real yields, a firm dollar and a cautious Fed should keep rallies capped despite persistent physical deficits.
- We see silver consolidating within $56–66/oz into late September, with dips supported but no clear trend emerging.
As we move through the middle of summer, silver is trading in a far calmer environment than the one that drove the Q1 rally. The market has now given back most of the premium that built during the first quarter, with spot prices falling from above $121/oz in January to around $58-59/oz in late July. The correction has been severe, but it reflects the removal of excesses that built during the rally, while the longer-term fundamental outlook remains constructive. Silver remains well above last year's lows and continues to benefit from a supportive supply-demand picture.
Spot Gold vs Silver ETF Holdings
Investment demand has moderated since Q1 highs.
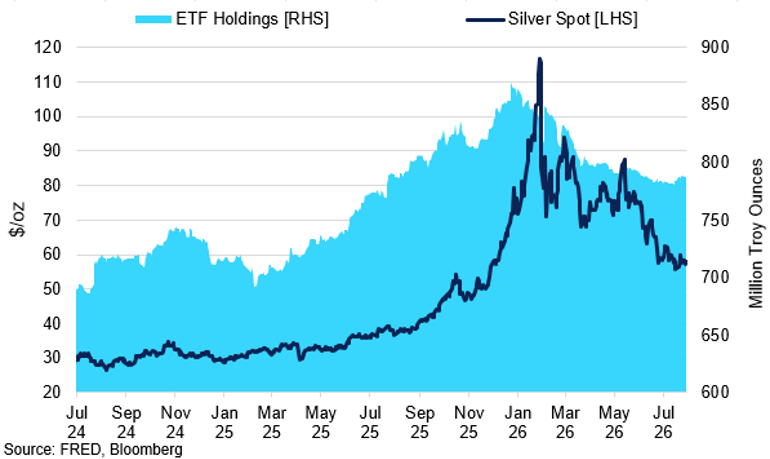
The macro environment remains the key factor limiting a stronger recovery. Fed Chair Kevin Warsh recently reiterated that returning inflation to target remains the central objective of monetary policy, reinforcing the view that policymakers are in no rush to ease. This has kept real yields elevated and supported the dollar, reducing the appeal of non-yielding assets. Silver is particularly exposed because it sits between the precious metals and industrial complexes. It benefits from inflation concerns and demand for hard assets, but it is also more sensitive to growth expectations and interest rates than gold. As long as the market expects policy to remain restrictive, rallies are likely to face resistance with silver trapped within a broad range.
Relative valuation has become far less compelling than it was at the start of the year. The gold-silver ratio has widened significantly from the January extreme, when silver strongly outperformed gold, and is now back near the high-60s. Research from the Silver Institute suggests the ratio retains long-term relevance, with a historical equilibrium slightly below 60:1 based on data stretching back to 1970. This suggests some scope for silver to outperform gold, but the valuation signal is no longer especially compelling. The exceptional premium that developed during the first-quarter rally has largely disappeared. With valuation now much closer to historical norms, the market is likely to require a fresh macro catalyst before investors become willing to pay higher prices.
Investor positioning also points to a market that has stabilised but has yet to regain strong upside momentum. As of 21 July, managed money net length on COMEX stood at just 11,282 contracts, while open interest remained relatively modest at 106,410 contracts. The reduction in speculative exposure has removed much of the liquidation risk seen earlier this year. Positioning leaves room for further buying, but current flows suggest investors remain cautious and focused on trading the range.
The physical market remains supportive. The World Silver Survey 2026 forecasts another deficit next year, with the shortfall expected at around 46.3Moz, extending a run of multi-year market deficits. Mine supply remains constrained and recycling is only partially offsetting the gap. Industrial demand also remains constructive, supported by electronics and grid investment. These fundamentals help explain why prices have remained resilient despite weaker investment flows. The deficit should continue to provide a floor, although physical tightness alone is unlikely to generate a sustained rally while real yields remain elevated and investor participation remains subdued.
Q3 Outlook:
We expect silver to mirror gold into late September. The physical deficit and light speculative positioning should help limit downside pressure, while elevated real yields, a firm dollar and a cautious Fed are likely to cap rallies. Silver should remain more volatile than gold, but with no clear trend. We therefore see silver consolidating within a broad $56-66/oz range through late September. Dips towards the mid-$50s should attract buying interest, while the current macro environment is unlikely to support a sustained move above the top of the range.
PGMs
Key Points
- Platinum has the stronger structural setup, supported by a fourth consecutive deficit, constrained supply and tight inventory cover.
- Palladium remains more tactical, with short-covering and supply-risk headlines offset by weaker auto demand and a possible small surplus.
- We see platinum rangebound at $1,520–1,780/oz and palladium at $1,150–1,420/oz into late September.
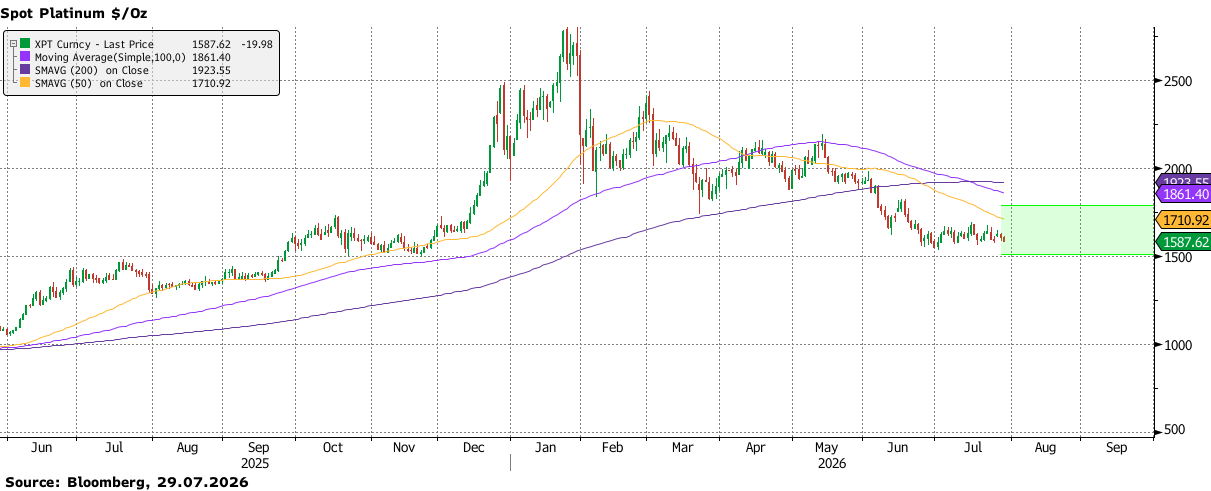
As we move through late July, platinum and palladium are both trading well below the speculative highs reached in January, but the two markets no longer have the same forward-looking setup. The correction across both metals has been severe, but the stronger fundamental case still sits with platinum. Palladium has bounced recently, but its recovery still looks more tactical, driven by short-covering and supply-risk headlines.
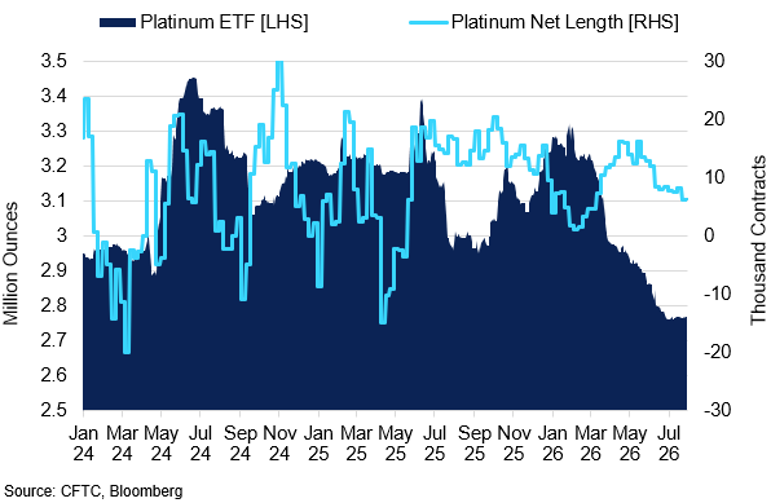
Platinum ETF Holdings vs Managed Money Net Position
Lower ETF holdings point to weaker investment demand, while modest net length leaves room for renewed buying.
Platinum’s main support remains the physical balance. The market is expected to record a fourth consecutive annual deficit in 2026, with the shortfall estimated at around 297koz (World Platinum Investment Council). Firm industrial demand and constrained mine output should continue to offset weaker jewellery and investment demand, leaving above-ground stocks below three months of demand. This keeps the medium-term supply picture tight, even after the sharp price correction. For prices, this should help protect the downside and encourage buying on dips, particularly around the $1,550/oz area. However, a sustained move higher is likely to require stabilisation in investment demand and a softer macro environment.
The macro environment remains the main constraint on a faster recovery. A hawkish Fed stance, higher energy-linked inflation expectations and stronger US yields have kept pressure on non-yielding assets, including platinum. ETF holdings had fallen by almost 520koz year-to-date by late July, while improved availability pushed one-month implied lease rates down to around 5%, from roughly 15% in Q4 2025. This shows that the market remains fundamentally tight, but the acute stress seen earlier has eased. Into late September, platinum should remain supported on pull-backs, although rallies are likely to struggle unless yields soften and ETF selling stabilises.
Palladium has a weaker structural setup than platinum. The market is expected to move from persistent deficits between 2012 and 2025 into a small surplus in 2026, with demand forecast to fall by 9% as ETF investment turns negative and automotive demand contracts alongside weaker gasoline vehicle production. Russian mine output is expected to fall to the lowest level in at least two decades, but stronger autocatalyst recycling should offset part of that supply pressure. This leaves palladium more exposed to headline-driven rallies, especially around Russian supply and trade policy, but the balance-sheet signal is no longer clearly bullish. For prices, this suggests sharp rebounds can occur, although follow-through is likely to fade unless physical availability tightens more visibly.
Positioning also reinforces the difference between the two metals. The latest COT data show managed money net long platinum by around 6.2k contracts as of 21 July, while palladium remained net short by around 6.6k contracts. Platinum positioning is not stretched, which reduces liquidation risk and leaves room for renewed buying if sentiment improves. Palladium’s net short position creates scope for short-covering rallies, but it also shows that investors remain unconvinced by the longer-term demand story. In price terms, this supports a relatively constructive platinum view and a more tactical, range-trading view for palladium.
Q3 Outlook:
We expect platinum to remain the stronger PGM into late September, supported by its deficit, constrained supply and tight inventory cover. Elevated real yields and weaker ETF demand should cap rallies, but dips are likely to attract buying interest. We see platinum consolidating within a broad $1,520–1,780/oz range. Palladium is likely to remain more volatile and less structurally supported. Russian trade-policy risk and light positioning can still trigger sharp rebounds, but weaker auto demand, improving recycling and a possible small surplus should limit follow-through. We see palladium trading within $1,150–1,420/oz.

