


NY 2nd Month Sugar Futures
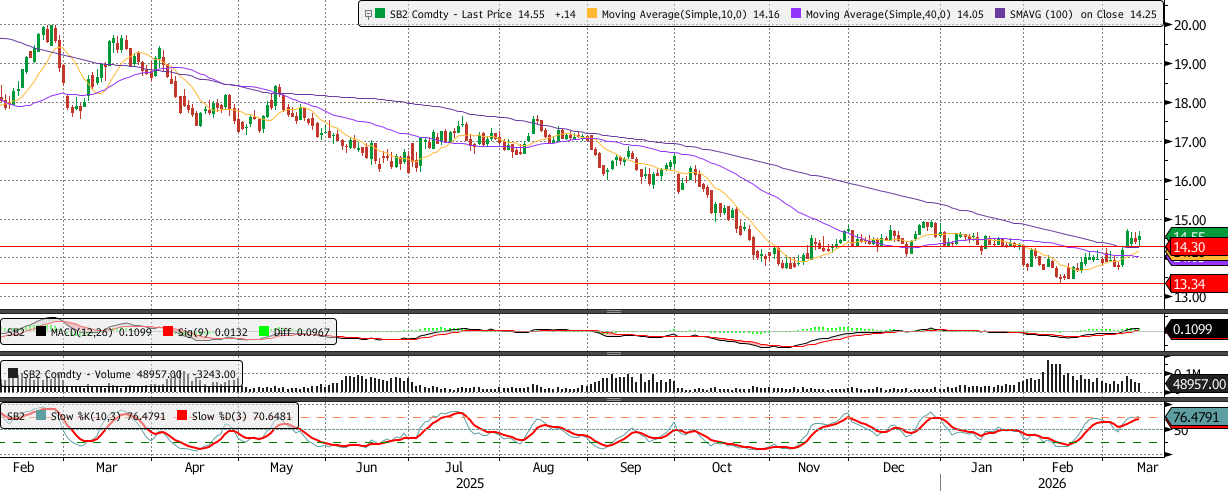
NY sugar futures edged higher on Thursday as prices closed at 14.55, extending the recovery and holding above the key moving averages, including the 10 DMA at 14.16, the 40 DMA at 14.05, and the 100 DMA at 14.25. This confirms that the short-term trend has shifted into a more constructive phase after the consolidation seen in February. Momentum indicators continue to support this improvement. The MACD diff remains positive and is diverging slightly, suggesting that buying pressure is gradually strengthening following the earlier downtrend. Meanwhile, the stochastics show %K rising to around 76 and remaining above %D, placing the indicator in overbought territory, which signals strong upside momentum but also suggests that the market may approach a short-term consolidation phase if momentum begins to slow.
Recent price action shows a steady sequence of higher lows since the late-February bottom near 13.34, indicating that buyers are gradually gaining control of the near-term trend. The key technical level now lies around 14.30, which previously acted as resistance and is now functioning as an important support area. Holding above 14.30 would confirm the strength of the current rebound, potentially allowing futures to extend higher towards the 15.00 level, the next notable resistance zone. Conversely, a failure to sustain gains above this level could see prices retreat toward the 10 DMA near 14.16, and a deeper pullback could expose the support around 14.00. For now, the positive momentum indicators and firm price structure suggest that the near-term outlook remains constructive, although the overbought stochastic levels may encourage a period of consolidation before further upside attempts.
Ldn 2nd Month Sugar Futures
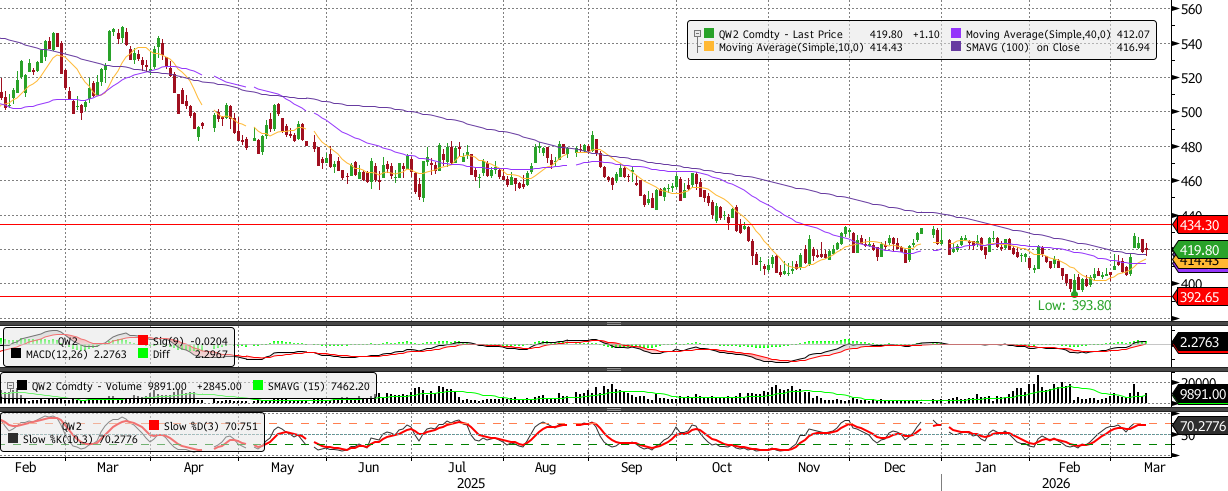
Ldn sugar futures also edged higher on Thursday, settling at 419.80, maintaining levels above the 10 DMA at 414.43, the 40 DMA at 412.07, and the 100 DMA at 416.94, confirming the continuation of the recovery from the late-February low near 393.80. The ability to hold above these moving averages reflects improving sentiment and a stabilisation of the short-term trend. Momentum indicators support this view, with the MACD diff remaining positive and diverging, indicating that selling pressure has eased and that the market is gradually building bullish momentum. At the same time, the stochastics show %K near 70 and holding above %D, placing the indicator in the upper range and signalling strengthening upside momentum.
Price action over recent sessions shows futures attempting to stabilise above the 420 area, which now acts as an important technical pivot following the rebound from February lows. If prices can sustain gains above this level, the recovery could extend towards the 434.30 resistance, which represents the next significant barrier for the market. A break above this level would strengthen the recovery structure and suggest a broader move higher. On the downside, support remains near the cluster of moving averages between 412 and 415, and a move back below this zone would weaken the recovery and risk a pullback towards 400, where stronger support has previously emerged. For now, momentum indicators remain supportive, although the elevated stochastic levels suggest that the market may consolidate before attempting a further push higher.
NY 2nd Month Coffee Futures
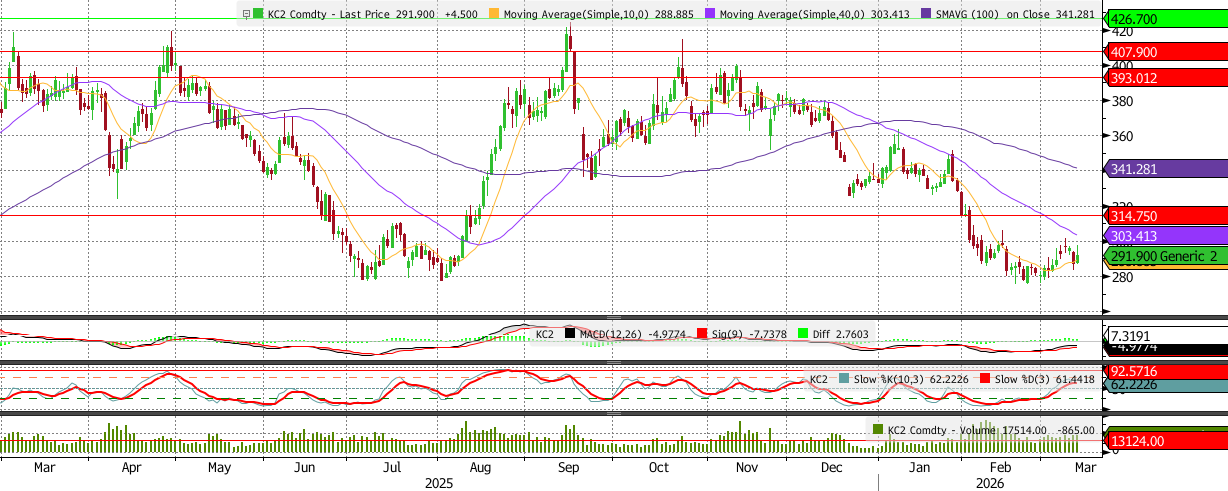
NY coffee futures edged higher on Thursday as prices closed at 291.90, holding above the 10 DMA at 288.89 but remaining below the 40 DMA at 303.41 and the 100 DMA at 341.28, indicating that the short-term recovery remains fragile within a still-bearish broader structure. Momentum indicators reflect a cautiously constructive tone. The MACD diff remains positive and is diverging slightly, suggesting that selling pressure has eased and that the market is attempting to stabilise following the February lows. Meanwhile, the stochastics show %K rising to around 62 and holding just above %D, signalling improving momentum although the indicator remains in the mid-range and far from confirming a strong bullish breakout.
Recent price action suggests that the market is attempting to build a base above the 280–285 support area, which has repeatedly held since the late-February decline. The immediate technical focus now lies around the 300 level, which continues to act as a key resistance barrier. A decisive break above 300 and the 40 DMA near 303 would confirm stronger recovery momentum, potentially opening the way towards 315 and then the broader resistance zone around 340. On the downside, support remains near 280, and a move below this level would weaken the stabilisation pattern and risk a return towards the February lows. For now, the indicators suggest a tentative recovery attempt, although the market must clear the cluster of moving averages above to confirm a more meaningful shift in trend.
Lnd 2nd Month Coffee Futures
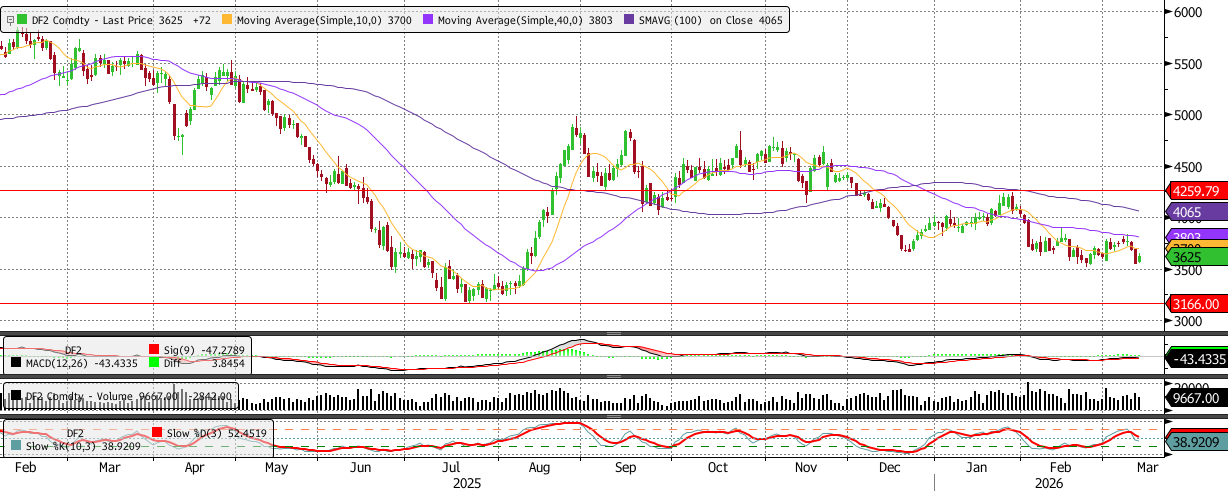
Ldn coffee futures slipped lower on Thursday, closing at 3625, remaining below the 10 DMA at 3700, the 40 DMA at 3803, and the 100 DMA at 4065, reinforcing that the broader trend remains under pressure despite the intermittent recovery attempts seen since February. Momentum indicators highlight this weakening tone. The MACD diff remains positive but is flattening, indicating that the earlier recovery momentum is fading. At the same time, the stochastics show %K around 39 and slipping below %D, signalling that upside momentum has weakened and that the market may be losing strength following the recent rebound.
Recent candles show hesitation after the recovery from the February lows, with prices struggling to regain the short-term moving averages. The immediate downside focus remains the 3500 area, which has repeatedly acted as support in recent weeks. A break below 3500 could accelerate losses and expose the next support near 3166, the key level seen during previous declines. On the upside, the market would need to reclaim the 10 DMA and then break above the 40 DMA near 3800 to confirm a more sustained recovery structure, which could then open the way towards 4000. Until these resistance levels are cleared, the market is likely to remain vulnerable to further consolidation within the broader downward trend.
NY 2nd Month Cocoa Futures
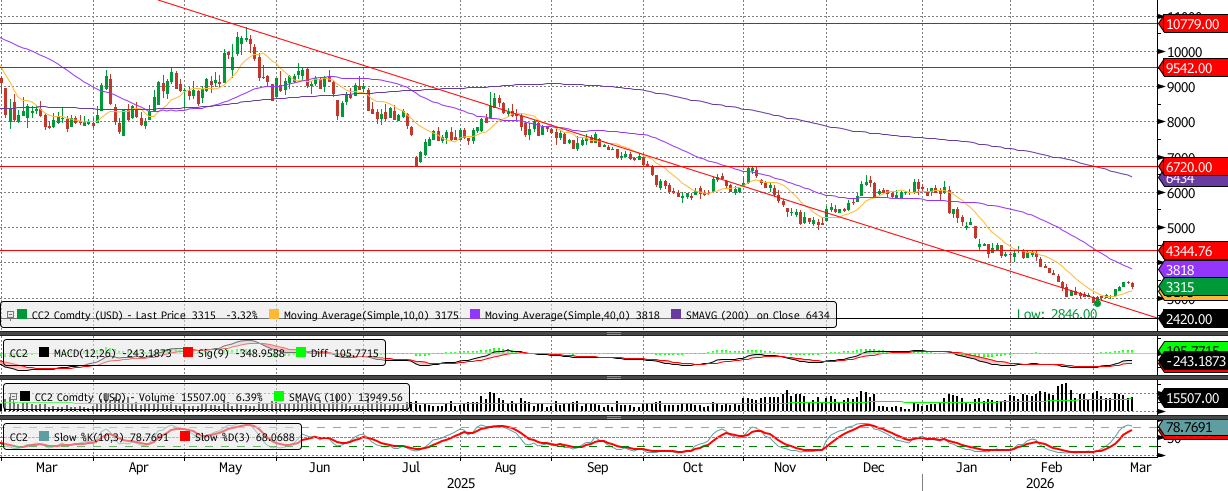
NY cocoa futures edged higher on Thursday as prices closed at 3315, extending the recovery from the late-February low near 2846. Futures are now above the 10 DMA at 3175 but remain below the 40 DMA at 3818 and well beneath the 200 DMA at 6434, highlighting that the recent rebound is still developing within a broader downward trend. Momentum indicators reflect improving buying pressure. The MACD diff is positive and diverging, signalling strengthening upside momentum following the recent stabilisation. Meanwhile, stochastics show %K rising to around 78 and remaining above %D, moving into overbought territory and indicating that the recent rally has gathered pace over the past sessions.
Price action over the last few days shows a sequence of higher closes as the market rebounds from the February lows, suggesting that a short-term base may be forming above the 3000 region, which now acts as the nearest support level. The immediate technical focus lies on the 40 DMA near 3818, which represents the first significant resistance barrier. A break above this level would confirm stronger recovery momentum and could open the way towards the next resistance zone near 4300. Conversely, if the recovery falters, the market would need to hold support around 3000 to preserve the improving short-term structure. A break below this level would weaken the recovery narrative and could expose the recent lows again. For now, the indicators suggest continued stabilisation with a constructive near-term bias, although futures must clear the 40 DMA to confirm a more meaningful shift in trend.
Ldn 2nd Month Cocoa Futures
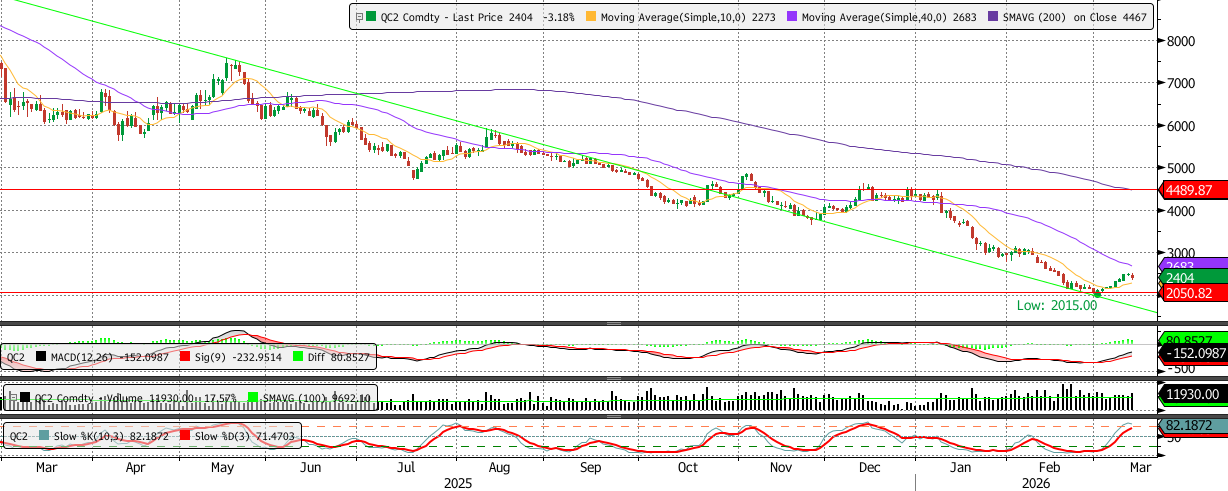
Ldn cocoa futures also moved higher on Thursday, closing at 2404, extending the rebound from the late-February low near 2015. Prices are now above the 10 DMA at 2273 but remain below the 40 DMA at 2683 and far beneath the 200 DMA at 4467, indicating that the market is still recovering within a longer-term bearish structure. Momentum indicators show improving conditions. The MACD diff is positive and diverging, signalling strengthening upside momentum following the recent recovery. Meanwhile, the stochastics show %K rising to around 82 and remaining above %D, moving into overbought territory and highlighting strong short-term buying pressure after the sharp decline seen earlier this year.
Recent price action shows several consecutive higher candles, suggesting that the market is attempting to establish a base after the February sell-off. The immediate technical focus now shifts to the 40 DMA near 2683, which represents the first meaningful resistance level. A break above this moving average could confirm a stronger recovery phase and open the way towards the psychological 3000 level. On the downside, support remains near 2050, which has acted as a key floor following the February lows. A move back below this level would undermine the recent rebound and could reintroduce downside pressure. For now, the indicators point to continued recovery momentum in the near term, although futures must reclaim the 40 DMA to confirm a more sustained reversal in trend.
