


Summary
The final quarter of 2026 has brought renewed macro pressure to commodity markets, with the Iran conflict pushing energy costs higher and complicating the outlook for monetary policy. Rather than providing broad safe-haven support, the conflict is increasingly being reflected through inflation expectations, the dollar and interest rates, creating an uneven impact across metals. For base metals, individual supply constraints, exchange inventories and sector-specific demand are becoming increasingly important, while precious metals remain particularly sensitive to the outlook for US monetary policy. We expect these forces to continue driving greater divergence across individual metals into year-end.
Aluminium
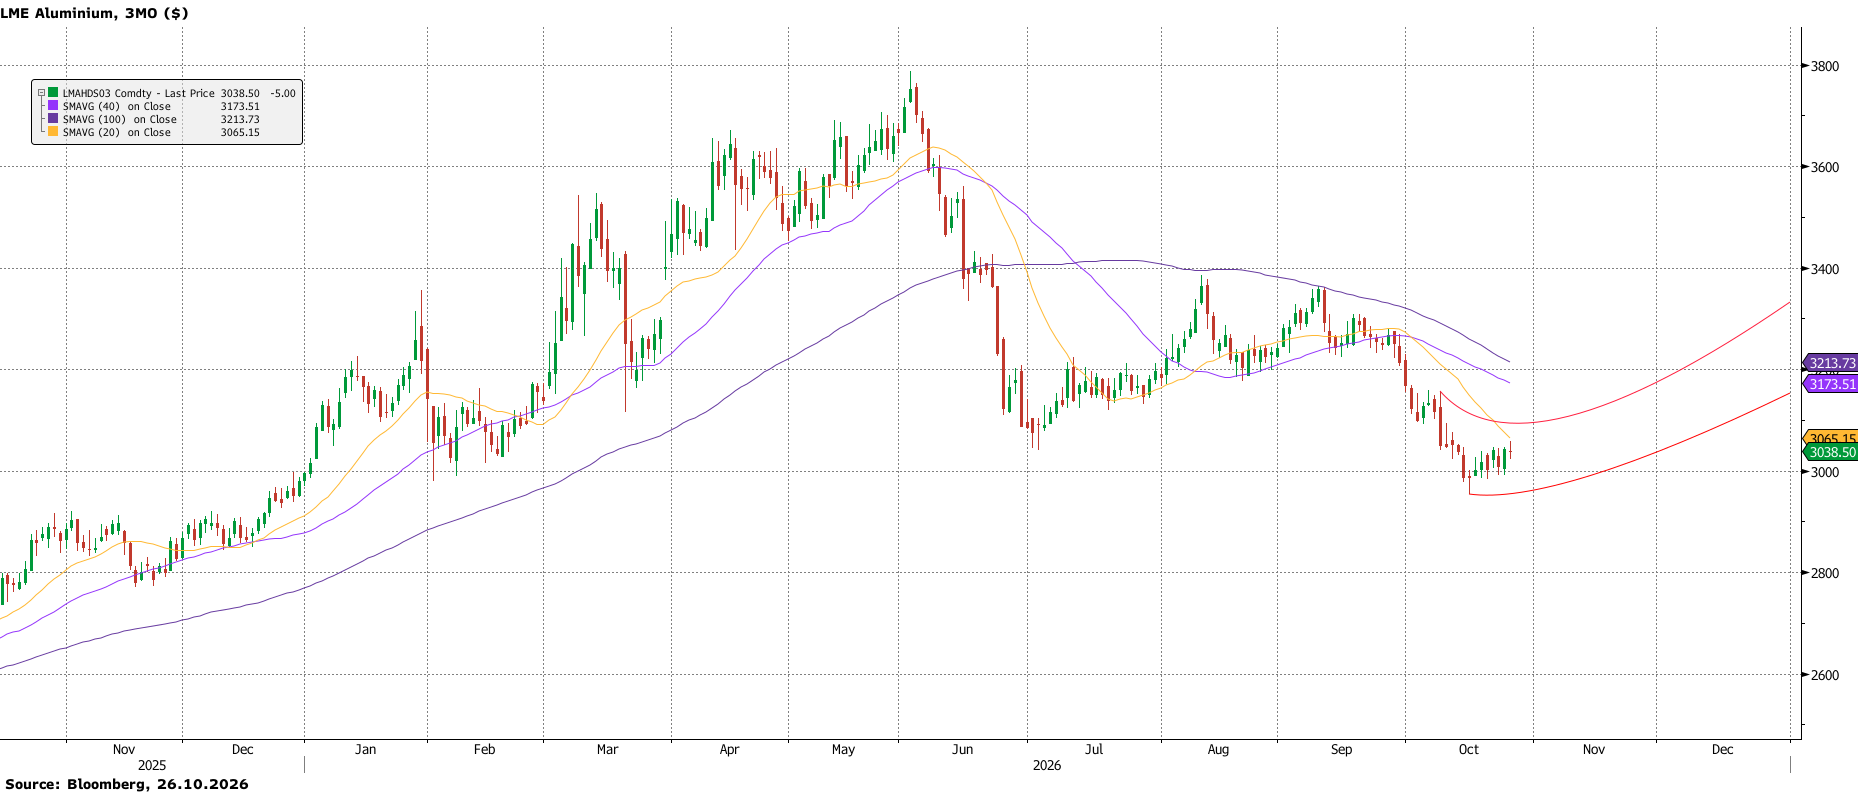
Aluminium has moved from a conflict-driven rally into a supported range as emerging Indonesian supply and recovering Gulf output reduce immediate shortage risk. However, Gulf production remains below pre-conflict levels, energy costs are elevated and physical buffers remain thin. We expect prices to hold around $3,000/t into year-end, with limited base-case downside and renewed disruption capable of restoring the risk premium.
Copper
Copper remains supported by tariff-driven inventory concentration in the US, tight ex-US availability and vulnerable mine and concentrate supply. Stable refined output and a modest surplus should limit a sustained extension, but the thin balance should support prices on weakness. We retain a modest upside bias into year-end, with resistance around $14,830/t and disruption the clearest catalyst for a breakout.
Lead
Lead remains broadly rangebound as warehouse flows and regional tightness create volatility against a moderately surplus global balance. Heavy fund shorts and falling live warrants leave scope for short-covering rallies, but lower headline stocks alone have not established a lasting shortage. We see support near $1,800/t and resistance around $2,000/t unless sustained withdrawals push nearby spreads into backwardation.
Nickel
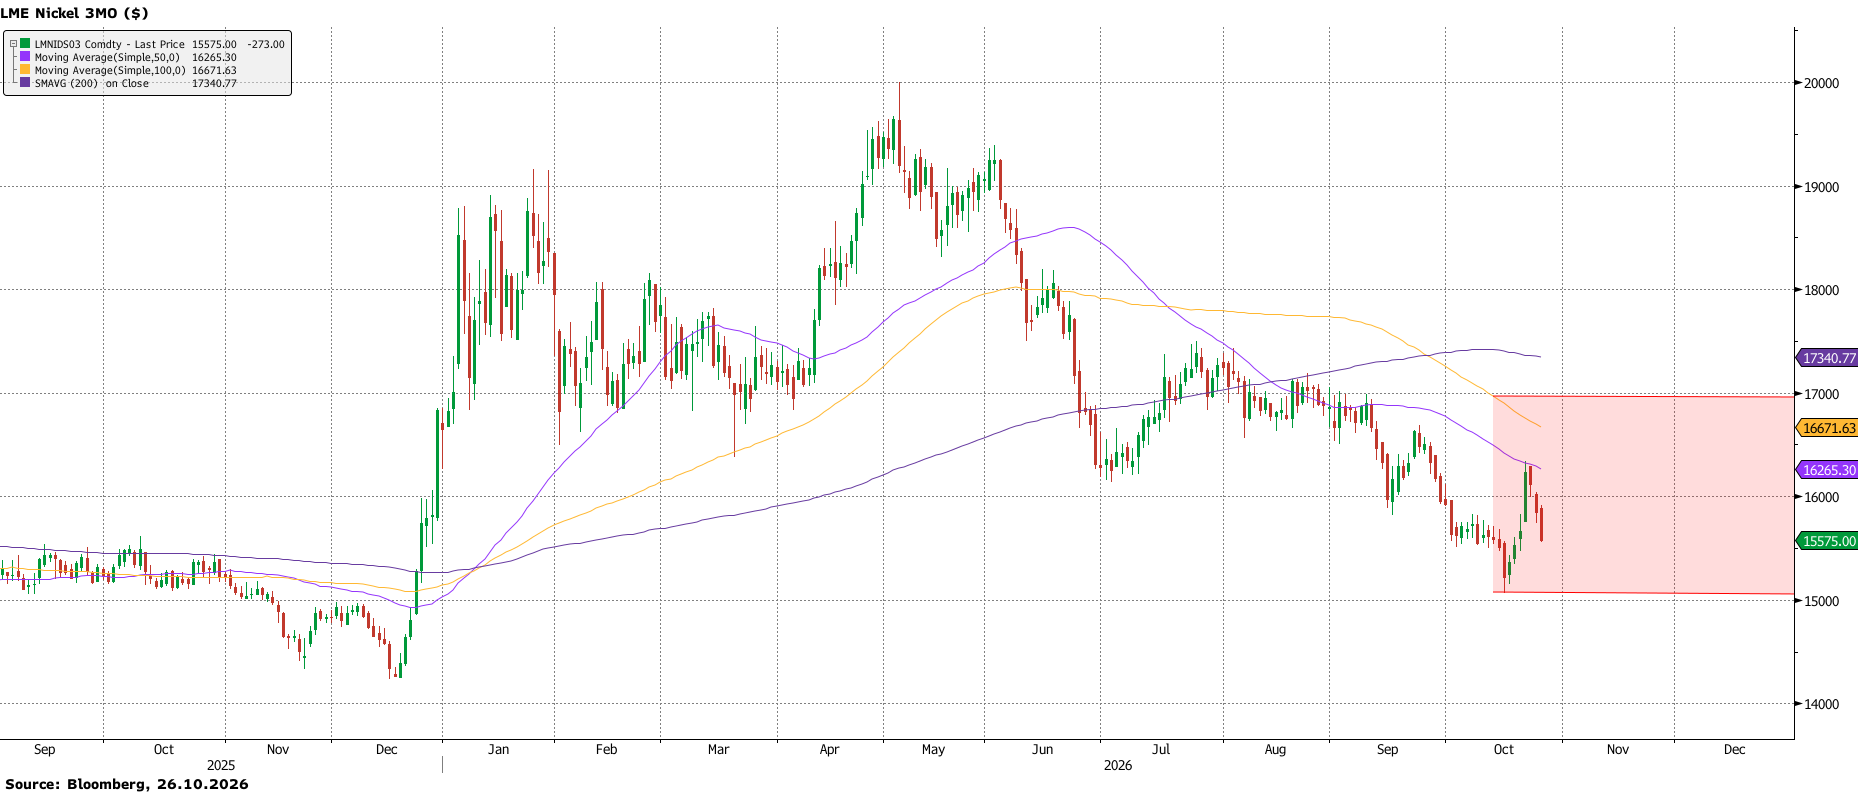
Nickel has stabilised near the lower end of its recent range as high-cost NPI, ferronickel and intermediate producers provide downside support. Strong Indonesian mined and finished supply, ample inventories and weak stainless-steel demand should cap rallies. We expect a rangebound Q4 with support around $15,000–15,500/t; sustained upside above $17,000/t requires confirmed, persistent Indonesian production cuts.
Tin
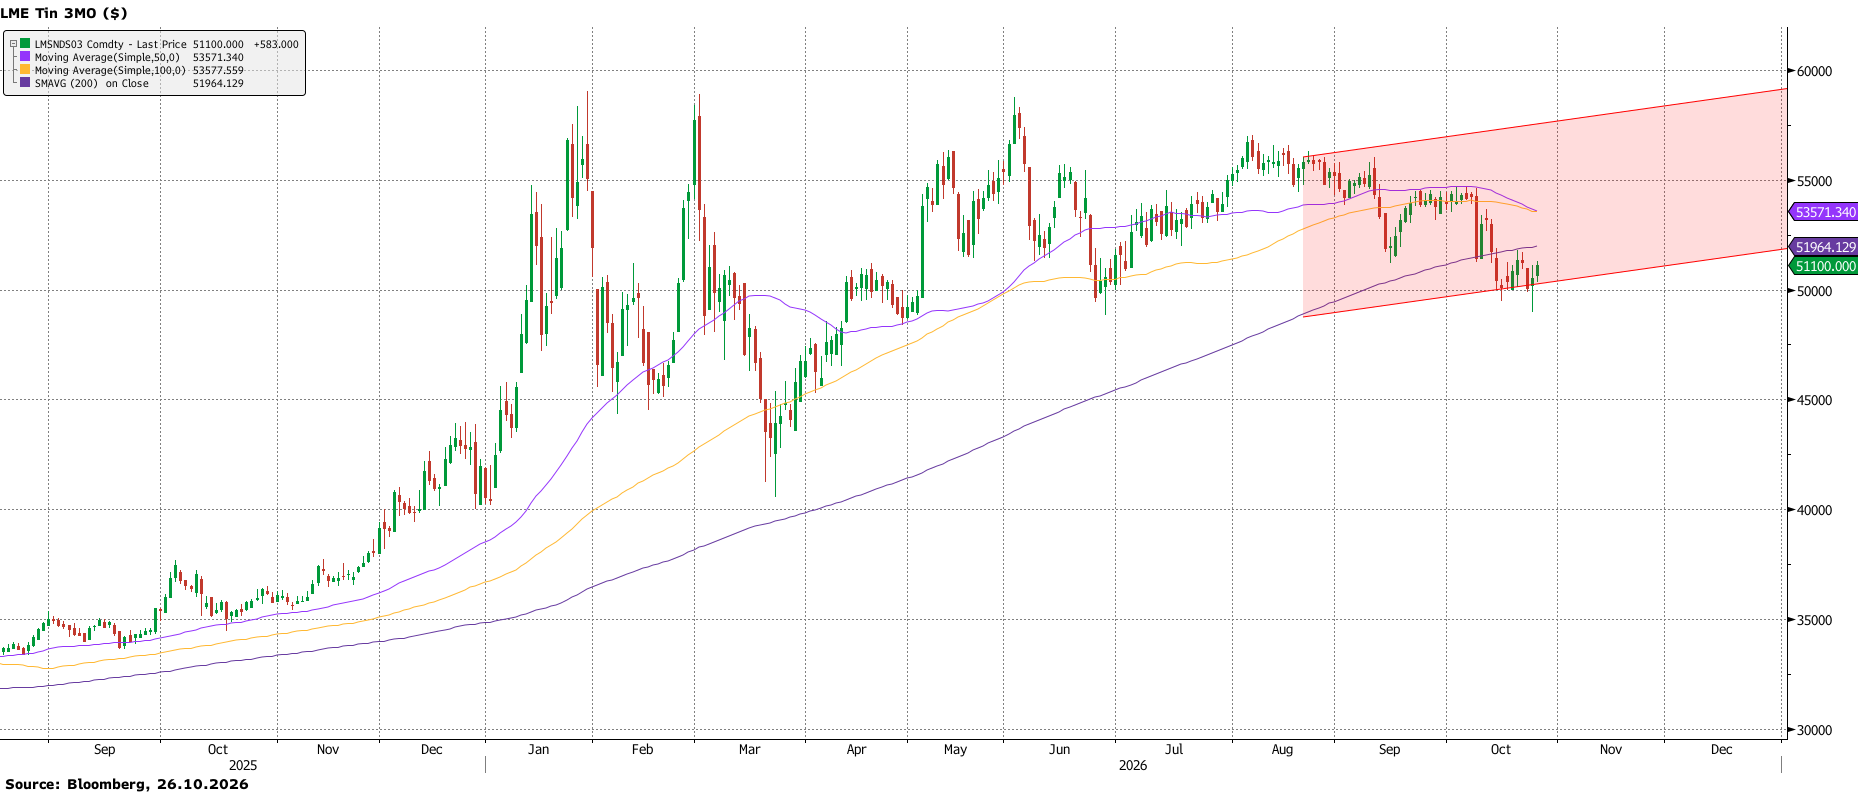
Tin retains a constructive physical outlook. Falling LME and SHFE inventories, nearby backwardation and temporary Chinese smelting constraints support prices. Prices should remain volatile, with support established at $50,000/t; renewed upside requires continued inventory depletion, persistent backwardation or fresh supply disruption.
Zinc
Zinc remains supported by a deepening concentrate shortage, record-low treatment charges and renewed tightness in London availability, with rising warrant cancellations leaving nearby spreads vulnerable to further tightening. We expect zinc to remain elevated but volatile into year-end, with support around $3,500/t and resistance near $4,000/t.
Iron Ore & Steel
Iron ore remains under pressure as resilient imports and rising port stocks contrast with contracting Chinese steel output, weak mill margins and soft property demand. Targeted stimulus should cushion rather than reverse the slowdown, while seasonal restocking may interrupt the decline. We retain a bearish Q4 bias, with firm cost support near $90/t and rallies likely capped around $100/t.
Gold
Gold remains under pressure as elevated oil prices reinforce inflation concerns, keeping US yields and the dollar firm. Central-bank and ETF buying should continue to cushion corrections, but a sustained recovery is unlikely until the Fed’s tightening cycle becomes clearer. We expect gold to remain vulnerable into December, with support around $3,900/oz before gradually recovering towards $4,200-4,300/oz by mid-January.
Silver
Silver remains under pressure as its greater sensitivity to US rates amplifies the impact of tighter monetary conditions. Weakening solar demand limits physical support, while light speculative positioning and constrained inventories should cushion further declines. We expect silver to find support around $50-53/oz before recovering towards $57-60/oz by mid-January as the Fed approaches the end of its tightening cycle.
PGMs
PGMs remain pressured by higher US rates and weak investment demand. We expect platinum to outperform palladium, supported by stronger fundamentals, while declining autocatalyst demand continues to weigh on palladium. Platinum will likely recover towards $1,700-1,800/oz by mid-January, while palladium should remain the weaker metal, with recovery limited to around $1,150–1,250/oz.
Watch our Q4 2026 Metals Market Webinar
Key Drivers
Tariffs Continue to Fragment Metal Availability: Tariff uncertainty is redirecting metal towards the US, most visibly in copper, and creating pockets of regional tightness despite broadly adequate global balances. Protectionist measures should remain an important source of inventory dislocation, spread volatility and short-lived price spikes.
Middle Eastern Conflict Premium May Have Unwound Too Far: Markets have largely discounted the Middle East risk premium even though Gulf production and logistics remain below pre-conflict levels. Renewed disruption could quickly restore the premium, while elevated energy costs and thin physical buffers should limit downside.
Mine Supply Cannot Respond Quickly: LME Week highlighted growing pressure to develop US and European copper and zinc supply, but new capacity remains a longer-term solution. Near-term availability will therefore remain constrained.
Macro and AI Narratives Remain Key Volatility Triggers: Fiscal and political uncertainty, movements in the dollar and shifting expectations around AI-linked demand will be key macro triggers in the coming months, with the potential to influence positioning and amplify volatility across metals.
Stable Demand Keeps Supply in Focus: We expect demand to remain broadly stable across the metals complex, leaving supply developments as the principal driver of price direction. With readily available inventories thin in several markets, outages, policy restrictions and regional dislocations could still trigger sharp moves even where global balances appear adequately supplied.
Macroeconomic Outlook
US
Growth Holds, but Inflation and Policy Risks Build
The US economy enters the final two months of 2026 with solid underlying growth but an increasingly difficult inflation outlook. Activity has held up better than expected, supported by AI-related investment and resilient consumer spending. However, the renewed energy shock, weaker hiring and the prospect of another Federal Reserve rate increase are likely to slow momentum into early 2027.
The US economy continued to grow strongly through the third quarter, supported by AI-related investment and resilient household spending. Following annualised growth of 2.2% in Q2, survey estimates point to growth of around 3.5% in Q3, while retail sales rose by 0.8% in September. However, higher fuel prices accounted for part of that increase, meaning the headline data overstate the strength of underlying consumption as households redirect more income towards essential spending.
This energy pressure is also keeping inflation on an upward path. Headline CPI reached 3.7% in September and producer prices recorded their largest monthly increase since 2022, as oil prices raised costs throughout the economy. Brent crude near $117/bl and WTI around $103/bl have pushed petrol to around $4.33 per gallon, while US diesel reached $6.28 per gallon in mid-October, around $2.66 higher than a year earlier. The temporary US-Russia arrangement on diesel imports could ease some supply pressure, but we expect its near-term price impact to be limited. Nevertheless, the agreement underlines the growing political importance of energy costs ahead of the midterm elections.
CPI YoY: US vs EU vs China
US inflation has picked up, remaining well above China’s but slightly below the eurozone’s.
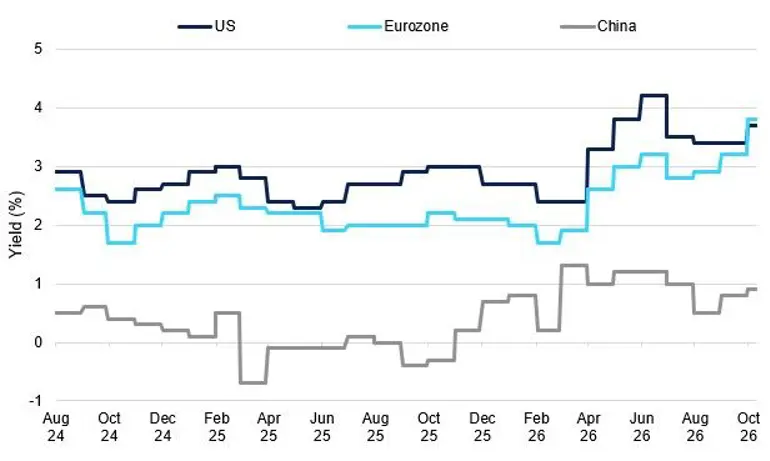
Source: Bureau of Labour Statistics, Eurostat, National Bureau of Statistics
The most likely midterm outcome is Democratic control of both chambers, but a Republican president would limit the scope for major new legislation. We expect political gridlock to leave the existing fiscal path broadly unchanged, while negotiations over government funding and the debt ceiling could create renewed uncertainty in 2027.
US trade policy is likely to become more restrictive after the midterms, regardless of the election result, as most tariff powers remain with the administration. The effective tariff rate was 7.1% in August, compared with around 2% in 2024, while scheduled measures could lift the headline statutory rate from 11.0% to 11.8% by year-end. Whether additional tariffs on excess industrial capacity and semiconductors are ultimately imposed or not, the prospect of new measures is likely to shape metals markets into early 2027 by influencing trade flows, regional premiums and expectations for industrial demand.
With tariff uncertainty likely to affect investment and trade, the labour market is becoming a more important constraint on domestic growth. September payrolls increased by only 29,000, well below expectations, while previous months were revised down by a combined 60,000. Unemployment remains relatively low at 4.2%, and initial jobless claims of around 194,000 suggest that companies are not making widespread redundancies. Nevertheless, hiring has effectively stalled. We expect weaker employment growth to weigh on household income and discretionary spending over the coming months, even if low layoffs prevent a sharper downturn.
The Federal Reserve must therefore balance a softer labour market against renewed inflation pressure. After raising its target range to 3.75–4.00% in September, we expect the Fed to hold rates on 28 October before delivering another 25bp increase in December. A peak of 4.00–4.25% remains the most probable outcome, although a further sustained rise in oil prices could require additional tightening. Treasury yields are consequently likely to remain high, restricting housing activity, business borrowing and demand for large consumer purchases.
The US enters 2027 with enough momentum to avoid a downturn, but limited room to absorb another energy or inflation shock. Even so, its stronger growth leaves it better placed than most other developed economies to withstand these pressures.
Eurozone
Energy Shock Tests a Fragile Recovery
Unlike the US, the eurozone is heading into winter with weaker growth and greater exposure to the energy shock. Economic activity is still expanding, but the October composite PMI fell to 51.9, a four-month low consistent with quarterly growth of around 0.3%. Following growth of only 0.4% QoQ in Q2, we expect high energy costs and stretched public finances to slow the economy further into early 2027, as heavily indebted governments have limited scope to support households and industry.
Europe’s exposure is most visible in natural gas. Dutch TTF prices have risen to around €96/MWh, their highest since 2022 and roughly three times the level a year ago, as Qatari LNG exports remain largely offline. Unlike oil, LNG cannot bypass the Strait of Hormuz through pipelines, leaving Europe and Asia competing for limited spot cargoes. Meanwhile, EU gas storage was only 74.6% full on 25 October, well below the five-year average of around 86%. Even if Gulf supply begins to recover, storage cannot be rebuilt during the winter, leaving prices highly sensitive to cold weather and periods of low wind generation.
The effects are already spreading through the wider economy. Eurozone inflation rose to 3.8% in September, with energy prices increasing by 18.9%. German wholesale electricity averaged approximately €168/MWh in October, its highest level in four years, as expensive gas-fired plants continued to set prices during peak hours. These costs are squeezing household purchasing power while weakening the competitiveness of energy-intensive industries, particularly chemicals and metals processing.
The cost-of-living pressure is also becoming politically difficult to contain. In France, student-led protests over education funding and conditions broadened into a nationwide mobilisation, with the demonstrations followed by rioting and almost 4,000 arrests. Governments face growing demands for relief at a time when public finances are already stretched. France is the clearest pressure point: its ten-year bond yield has risen above 5%, while the spread over German debt reached almost 180bps in October. High deficits leave governments with limited room to cushion households and industry without adding to borrowing concerns.
France vs Germany: 10Y Yield and Spread
French 10-year yields have diverged sharply from Bunds since end-August.
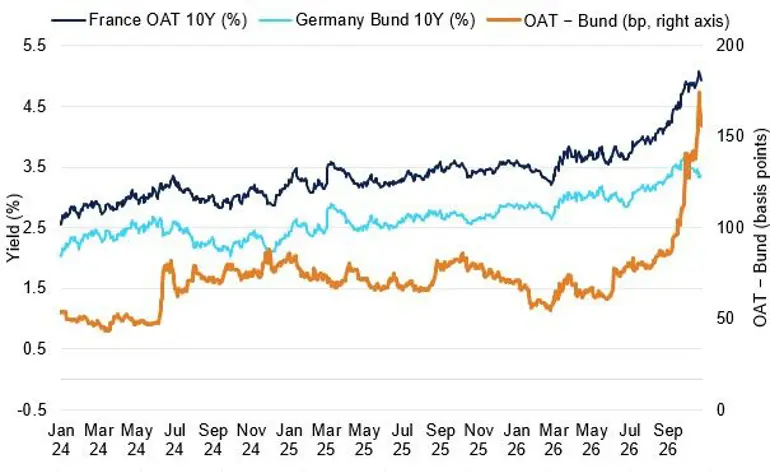
Source: FRED
The ECB must therefore manage above-target inflation while economic momentum fades. After raising its deposit rate to 2.50%, we expect it to hold in October before increasing rates again in December. This should keep financing costs elevated and place further pressure on construction, manufacturing and consumer demand.
For metals, Europe’s energy disadvantage remains a central concern. High electricity and gas prices increase smelting and processing costs, raising the risk of further production curtailments and tighter regional availability. This may support European premiums for some metals, but weaker manufacturing and construction activity will limit underlying demand. The eurozone therefore enters 2027 caught between constrained metals supply and an industrial economy increasingly unable to absorb higher prices.
China
Targeted Stimulus Supports Metals, but Property Remains the Constraint
China’s economy is likely to maintain steady growth into early 2027, although recent policy support is reinforcing an increasingly two-speed economy. GDP expanded by 4.5% YoY in Q3, taking growth to 4.6% over the first nine months of 2026. Industrial output rose by 5.5% in September, and high-tech manufacturing grew by 14.3% YTD, while retail sales increased by only 1.1% and private investment fell by 10.4%. Growth therefore continues to depend more on exports, advanced manufacturing and public investment than on households or private businesses.
The latest stimulus is designed to support activity without introducing a broad credit-led package. Authorities have allocated RMB550bn of unused local-government debt quotas, which must be issued and spent by year-end, while part of the 2027 quota will be brought forward to allow investment to continue from January. This follows the completion of RMB1.3tn in ultra-long special bond issuance, including RMB800bn for strategic projects and RMB200bn for equipment upgrades. The measures should strengthen spending on electricity networks, transport links and industrial equipment during Q4 and early 2027.
Monetary policy is also becoming more supportive, although headline lending rates remain unchanged. The one- and five-year loan prime rates were held at 3.00% and 3.50% in October, but the central bank is providing cheaper overnight funding through large reverse-repurchase operations. We see this as a measured attempt to improve liquidity without encouraging another broad increase in debt.
Property remains the main constraint. Investment fell by 20.6% over the first nine months, new-home sales declined by 13.9%, and construction value added contracted by 4.4% in Q3. The new mortgage subsidy may bring forward some first-home purchases, particularly outside the largest cities, but its strict price and property-size limits mean it is unlikely to deliver a national housing recovery.
China Property Sales
House-price breadth has improved from recent lows, but property investment has fallen further into contraction.
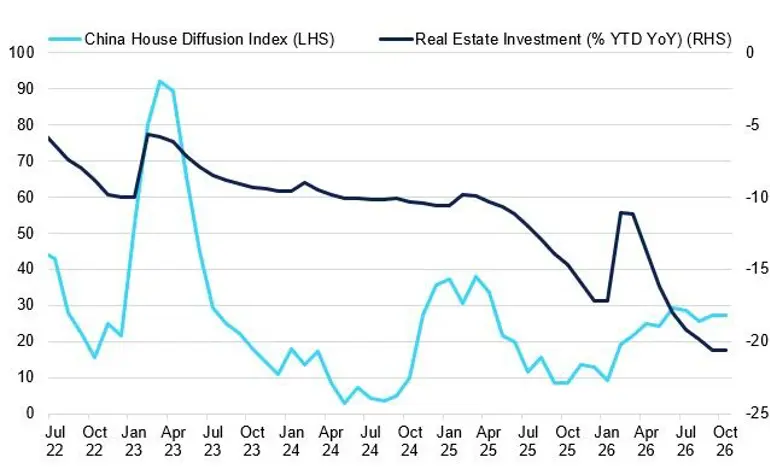
Source: National Bureau of Statistics of China
This policy support should benefit base-metals demand selectively, with copper best placed to gain. State Grid investment exceeded RMB450bn in January-September, while year-end orders for ultra-high-voltage lines should reinforce demand from power networks, data centres and equipment upgrades. Low domestic inventories and firmer import premiums provide further support, although elevated prices are already encouraging fabricators to limit purchases to immediate requirements. Aluminium could benefit from investment in power grids, communications and transport, although continued weakness in construction is likely to offset part of this demand. Zinc and steel remain the least supported, as their greater exposure to construction leaves them vulnerable to the property downturn.
These differences mean China’s stimulus cannot be translated into a single view across the complex. The outlook for each metal will depend on how infrastructure support, property weakness and physical market conditions interact into early 2027.
Aluminium
Key Points
Aluminium’s war premium has largely unwound, but Gulf output remains below pre-conflict levels and elevated energy costs are adding to smelter cost pressures.
Chinese exports and emerging Indonesian supply have partly bridged the gap, although limited exchange-deliverable metal and slower capacity additions leave physical buffers thin.
We expect prices to remain supported around $3,000/t into year-end, with limited base-case downside and renewed Gulf disruption capable of restoring a risk premium.
Despite the unresolved conflict, markets largely discounted the Middle East war premium in Q3 2026, taking LME aluminium back towards early-year levels around $3,000/t. Positioning and derivatives also contributed: call length was liquidated, producer hedging added downside flow and CTAs reduced base-metals exposure, while wider deferred spreads and a break below trend support accelerated systematic selling. With much of that adjustment complete and curve tightness reappearing, the market appears to have established a near-term floor.
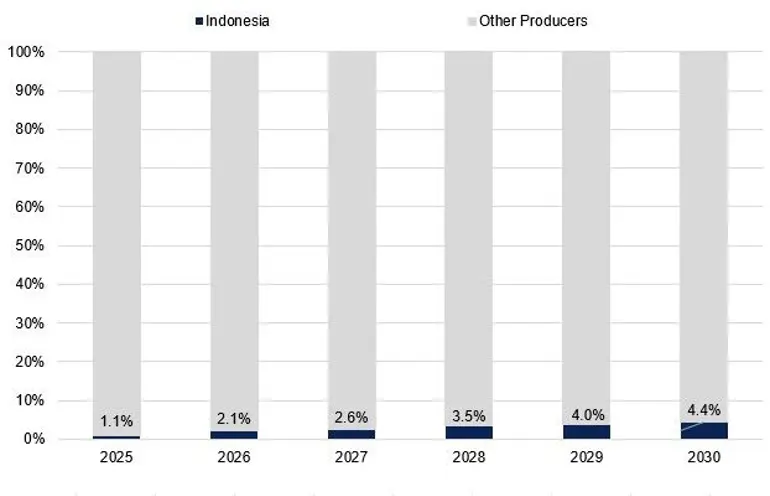
Indonesia Share of Global Primary Aluminium Supply
Indonesia is adding primary aluminium capacity but remains a marginal supplier within the overall global supply path.
Source: Minespans
Chinese and Indonesian replacement supply, together with inventory drawdowns, has reduced acute shortage concerns. However, the physical market has not fully normalised: Gulf output and logistics remain below pre-conflict levels, regional tensions still threaten production and shipments, elevated energy prices are raising smelter costs, and Indonesia’s planned additions remain a longer-term supply story extending to 2030.
According to IAI, Gulf output had recovered to an annualised run rate of around 3.6Mtpa by August, roughly 60% of the pre-conflict rate of 6.1Mtpa. Emirates Global Aluminium had restored approximately 25% of its reduction cells, Alba’s utilisation continued to recover and Qatalum remained near 60%. We expect supply growth to normalise in 2027 rather than this year. Our base case assumes MENA primary smelter supply rises 41.8% to 6.50Mt, although this depends on continued recovery and a diminishing impact from fresh regional attacks—a relatively strong assumption.
China remains the largest primary aluminium producer, but smelters are close to the country’s 45Mt capacity ceiling, limiting major additions. Its contribution is more visible through trade: exports of unwrought aluminium and aluminium products reached 656,000t in September, up 25.9% YoY, taking January–September shipments to 5.32Mt, up 17.8%, according to GACC. Yet much of this material is alloy or semi-finished product, easing downstream shortages without replenishing exchange-deliverable inventories or replacing disrupted Gulf ingot.
Indonesia is emerging as a source of primary supply. According to LME Insight, unwrought aluminium exports rose 63.1% YoY to about 420,000t in H1 2026, flowing to the US and Europe and partly replacing Middle Eastern units. Higher physical premiums favour direct customer sales over exchange delivery, leaving the global buffer thin. Power availability also constrains how quickly announced capacity becomes reliable output, making Indonesia more important later in the decade than immediately.
Our forecast puts the 2026 refined deficit at about 3.0Mt, narrowing to 1.0Mt in 2027 as Gulf output recovers and Indonesian capacity gradually comes online. Demand growth remains stable, with stronger transportation, construction and appliance demand partly offset by weaker growth elsewhere. Data centres account for only 3% of demand in 2026, rising to 5% by decade-end.
Q4 Outlook:
Aluminium remains principally a supply story into year-end. Chinese and Indonesian material can offset part of the disruption but cannot quickly replace another Gulf outage, while LME inventories have fallen around 50% since the conflict began. High energy costs and limited physical buffers should support prices around $3,000/t. However, stable demand and gradually recovering supply provide little catalyst for a sustained rally. Risks remain asymmetric: base-case downside is limited, while renewed Gulf production or logistics disruption could quickly restore the risk premium.
Copper
Key points
Copper remains fundamentally supported by tight ex-US availability, vulnerable mine supply and constrained concentrate markets, despite a refined surplus.
Tariff uncertainty continues to draw metal into the US; inventories should remain relatively sticky and sustain LME prompt tightness.
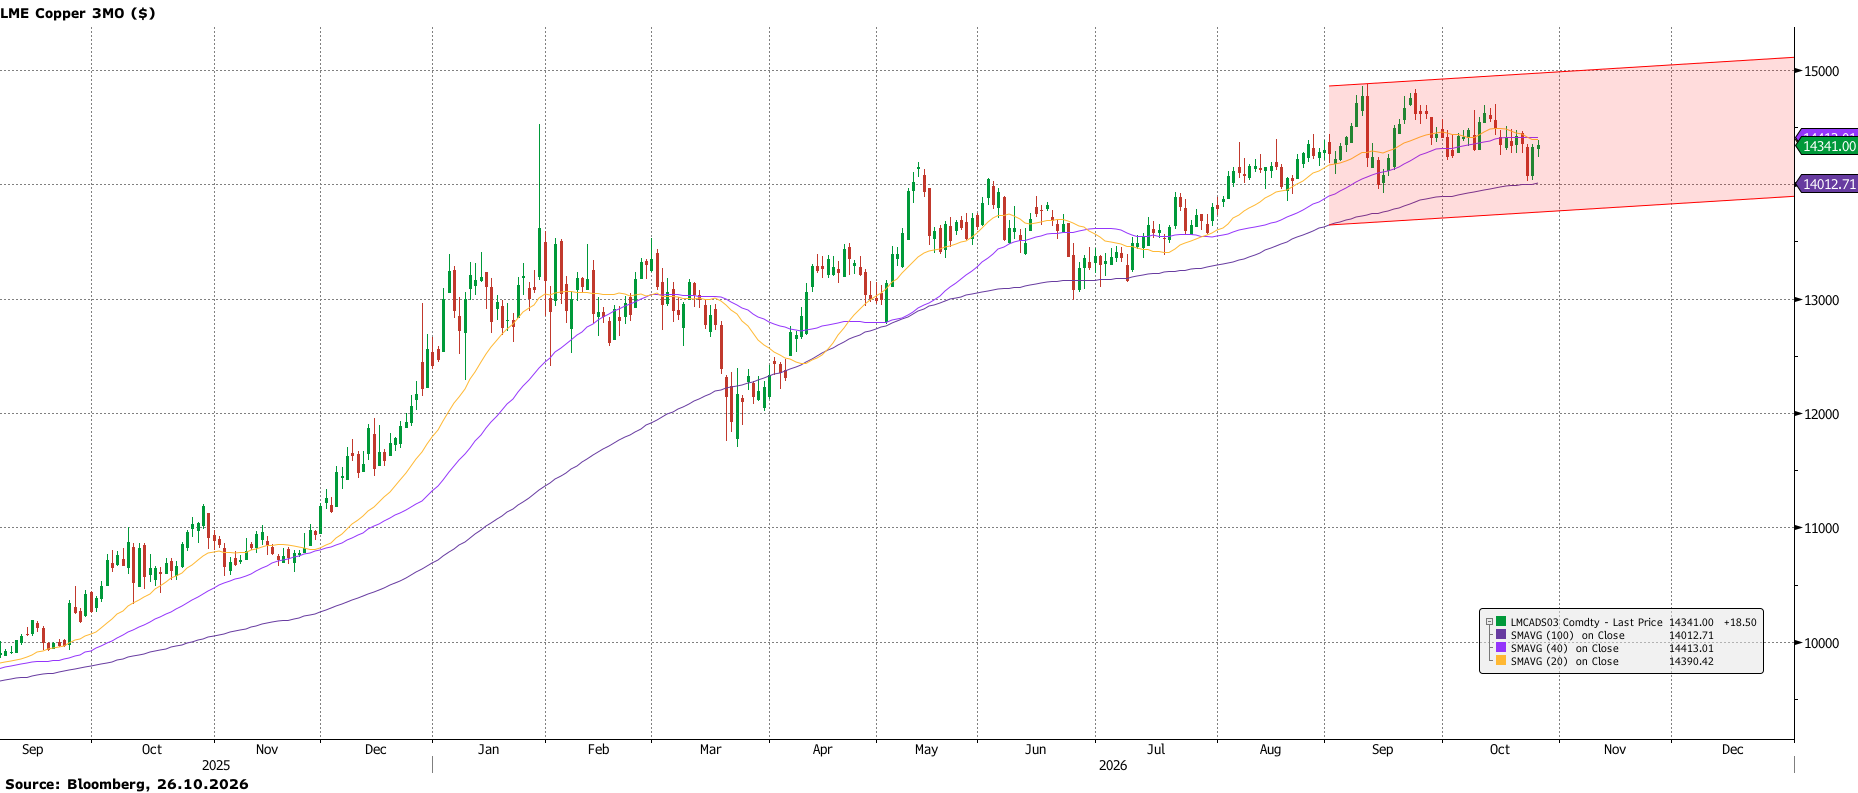
We retain a modest upside bias into year-end, but resistance around $14,830/t and the absence of a confirmed outage should keep trading volatile rather than drive a clean rally.
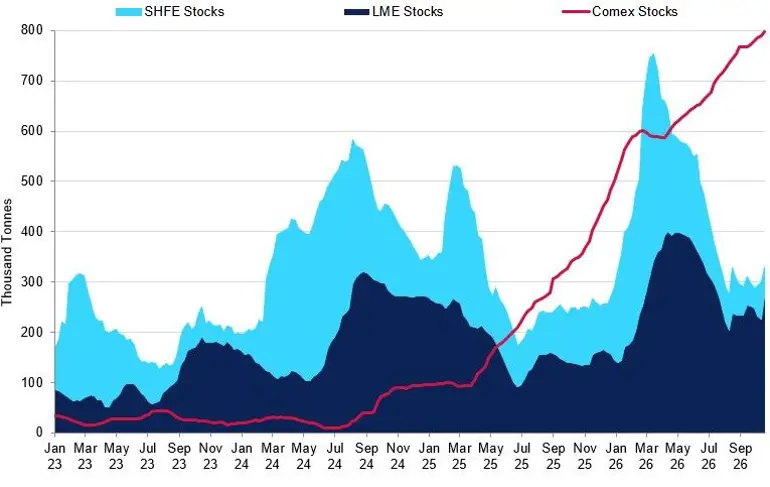
Copper gained further momentum in Q3 2026, reaching $14,830/t, but trading became increasingly volatile as US tariff uncertainty collided with technical resistance and crowded positioning. Policy risk has distorted the location of refined copper: COMEX held more than 799,000t by mid-October—roughly 70% of visible exchange inventories—while LME stocks were around 270,000t and the cash-to-three-month spread remained in backwardation. Prompt metal is therefore comparatively tight outside the US.
Although refined cathode remains exempt from current Section 232 tariffs and the proposed 15% duty from 2027 remains uncertain, metal continues to flow towards the US. Government support for domestic manufacturing under Project Vault gives holders another reason to retain cathode domestically, while unresolved policy risk preserves the option value of US warehouse stocks even as the COMEX–LME arbitrage narrows. Their scale and persistence suggest that much of the metal may remain until domestic demand absorbs it.
A decision against tariffs would probably slow new US-bound shipments rather than trigger an immediate release of existing stocks. Re-exporting cathode to London or Asia would require an arbitrage sufficiently negative to cover freight, insurance and financing—conditions we do not expect soon. While substantial tariffs remain unlikely, the threat alone could continue drawing copper into the US through year-end, constraining ex-US availability and sustaining LME prompt tightness. Regional availability, rather than headline global inventories, should therefore remain central to price formation.
Combined LME & SHFE vs COMEX Stocks
COMEX stocks have risen to record highs above combined LME and SHFE inventories, highlighting a fragmented distribution of global copper stocks.
Source: LME, SHFE, COMEX
The mine and concentrate backdrop reinforce price support. Chilean output fell 12.8% YoY in August to 369,500t, its weakest monthly result since 2011. Despite the resolution of the latest strike, Escondida’s FY2027 guidance of 1.0–1.1Mt remains below FY2026 production of 1.26Mt, reflecting planned lower ore grades. Declining grades and operational complexity therefore look more important than any single labour dispute. Spot treatment charges near -$127/mt in early July further confirm intense competition for scarce concentrate. Chinese smelters have nevertheless maintained refined output by relying on sulphuric acid, zinc and precious-metal by-product revenues, although that cushion is weakening as acid prices fall and scrap remains constrained. This resilience explains why concentrate tightness has not yet produced broad refined-output cuts.
Our base case has the refined surplus widening modestly from around 20kt in 2025 to 100kt in 2026, leaving the market adequately supplied under normal conditions but with little capacity to absorb another meaningful outage. Deficits are expected to emerge and widen from 2028, supporting the longer-term price floor; nearer term, disruption remains the clearest catalyst for additional upside.
Q4 Outlook:
Copper’s backdrop remains supportive because tariff-driven inventory concentration in the US limits readily available metal elsewhere, while mine and concentrate supply remain vulnerable. Without a confirmed outage, stable refined production and a small surplus should limit further gains, but the thin balance should also support prices on weakness. We retain a modest upside bias, although resistance around $14,830/t should prevent a clean advance and keep the trading range wide. A macro pullback linked to the AI narrative is possible, but we expect it to be shallower and shorter-lived than some anticipate. We therefore prefer adding exposure on material weakness while treating strong rallies without confirmed production losses cautiously.
Lead
Key points
Lead remained broadly rangebound despite large swings in reported LME stocks, as warehouse activity and financing flows obscured the underlying physical balance.
Tighter Chinese availability and heavy fund shorts can trigger prompt-spread or short-covering rallies, but the global refined market remains in moderate surplus.
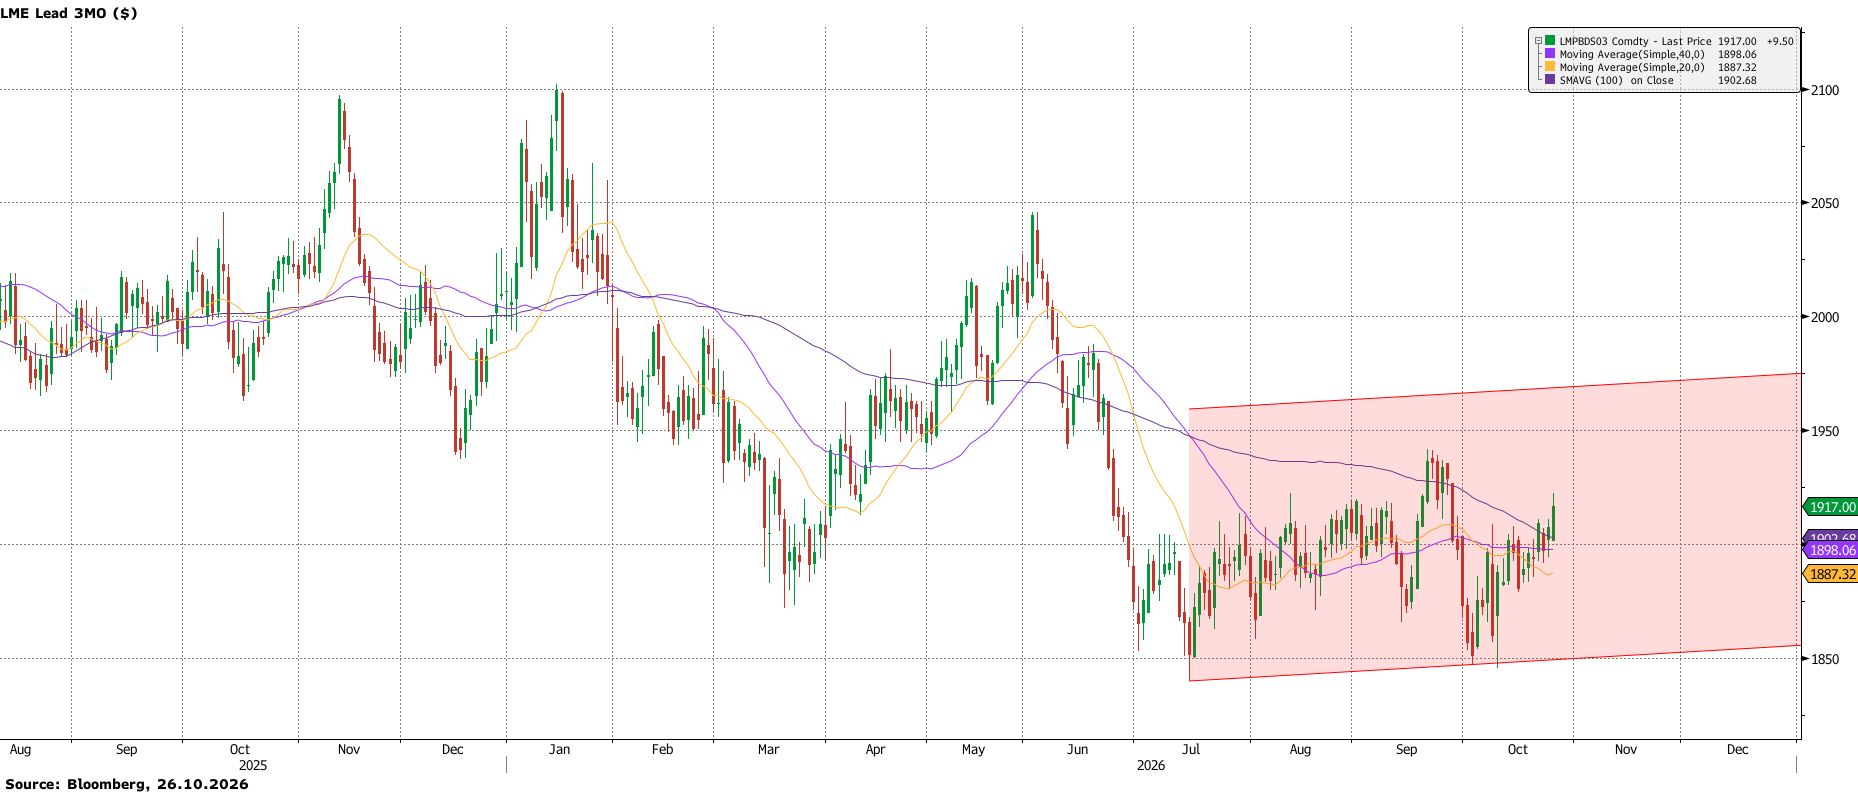
We expect a broadly rangebound Q4, with support near $1,800/t and upside capped around $2,000/t unless inventory withdrawals produce sustained backwardation.
LME lead traded in a relatively contained range through Q3, although changes in reported stocks created sharp dislocations. The largest occurred in mid-July, when inventories rose by 167,200 tonnes over two sessions to 450,000 tonnes, largely reflecting concentrated warranting in Singapore. Three-month lead fell to $1,843/t before recovering above $1,900/t by 23 July despite elevated stocks. The increase reflected warehouse rental and financing activity, as metal moved from off-warrant into registered storage rather than signalling comparable demand deterioration.
Stocks subsequently declined towards 320,000 tonnes but lead still struggled to sustain rallies above $1,950/t. Lower headline inventories alone were therefore insufficient to establish a lasting shortage. The market can tighten abruptly when cancellations rise or nearby availability falls, but such moves should fade unless cancelled warrants translate into sustained physical withdrawals and off-warrant inventories also decline.
That distinction remained important in October. Rising cancelled warrants supported nearby spreads, while total LME stocks were around 330,000 tonnes on 21 October. The cash-to-three-month contango narrowed to $24/t that day, signalling firmer prompt conditions. However, the evidence does not establish whether physical withdrawals, financing transactions or prompt-specific flows drove the adjustment. Persistent tightening into backwardation would provide stronger confirmation.
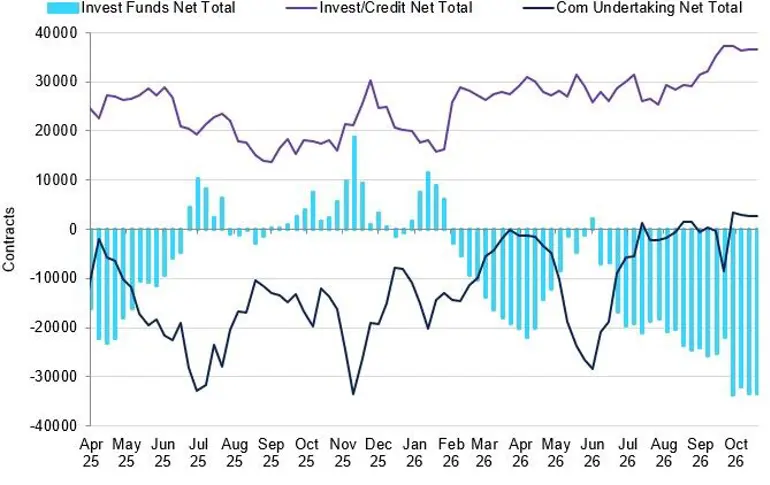
Positioning adds volatility. Investment funds’ net short increased from about 25,000 lots on 18 September to 33,000 on 2 October, initially driven mainly by new shorts. It remained near that level into late October, although funds had begun covering shorts while liquidating a similar volume of longs, signalling de-risking rather than a stronger bearish bet. The persistent net short leaves lead vulnerable to short-covering if nearby spreads tighten. Net length among investment, credit and commercial participants has helped absorb speculative selling and support outright prices.
LME Lead COT Positioning
Heavy investment-fund shorts leave lead vulnerable to short-covering rallies if nearby spreads tighten.
Source: LME, Sucden Financial
Regional fundamentals are firmer in China. SHFE registered warrants fell from 42,200 tonnes on 30 September to 18,300 tonnes on 22 October as maintenance and seasonal battery restocking tightened availability. Refined lead imports reached 174,900 tonnes in January–September 2026, up 642% YoY, redirecting regional flows. India was an important source earlier in the year, although imports have since diversified. This may reduce the pool available for LME warranting in Singapore. However, Chinese exchange tightness does not indicate a structural acceleration in global consumption.
The broader market remains in moderate surplus. ILZSG forecasts production exceeding demand by 90,000 tonnes in 2026, widening to 163,000 tonnes in 2027. Supply is projected to grow 1.5% next year against demand growth of 1.0%, supported by additional output in India and South Korea and a recovery in China. The surplus should constrain sustained upside, even as regional shortages and warehouse distribution create shorter-term dislocations.
Q4 Outlook:
The balance favours a rangebound market, with downside pressure from ample supply and warehouse-delivery risk. We see support near $1,800/t, an important cost threshold for Chinese production. Short-term rallies may emerge as LME stocks and live warrants fall, particularly if heavy speculative shorts cover. However, upside should remain capped near $2,000/t unless withdrawals are sustained, off-warrant inventories also decline, and the cash-to-three-month spread moves persistently into backwardation. Until then, rallies driven mainly by warrant activity or temporary spread tightness should be treated cautiously.
Nickel
Key Points
Indonesia’s tighter RKAB quotas drove a sharp rally, but stronger mine output and new processing capacity left the broader market well supplied.
High-cost NPI, ferronickel and selected intermediate producers support a floor near $15,000–15,500/t, while abundant supply caps the upside.
Sustained upside above $17,000/t requires confirmed, persistent Indonesian production cuts followed by a visibly tighter physical balance.
Nickel’s retreat from $20,000/t in late April to $15,000–15,500/t reflects the gap between anticipated and realised Indonesian supply cuts. Lower RKAB quotas initially raised fears that smelters would face insufficient ore; domestic feedstock and sulphur prices rose, increasing HPAL costs and expectations of weaker finished output. By Q3, however, sulphur had declined, the limonite reference price was revised lower, and some mines ramped faster than expected. The initial cost shock therefore eased, allowing prices to return to levels seen earlier this year.
The latest forecasts indicate that the policy has tightened parts of the ore market without changing the broader picture of ample supply. Our combined 2026 mined and finished supply forecast has been revised higher to 7.8Mt, with stronger mine output and new NPI and cathode capacity offsetting restrictions on individual quota-constrained producers. RKAB announcements can move prices sharply, but their fundamental impact depends on where quotas bind and whether output elsewhere compensates. So far, tighter approvals have created local feedstock pressure and volatility rather than a meaningful reduction in aggregate nickel availability.
Producer economics provide downside support. NPI and ferronickel producers remain exposed to saprolite, coal and electricity costs, and sizeable Indonesian NPI and Brazilian ferronickel operations approach breakeven around current prices; some MHP and matte projects also sit higher on the cost curve. In H1, Indonesian NPI output fell 10%, RKEF utilisation declined to 76%, and HPAL output fell 6%, but these were mainly utilisation cuts rather than permanent closures. Integrated groups can keep marginal plants operating using earnings from mining, captive power, cobalt credits or downstream refining. Weak prices may therefore force temporary cuts and establish a floor, but capacity can return quickly and output elsewhere can offset the losses.
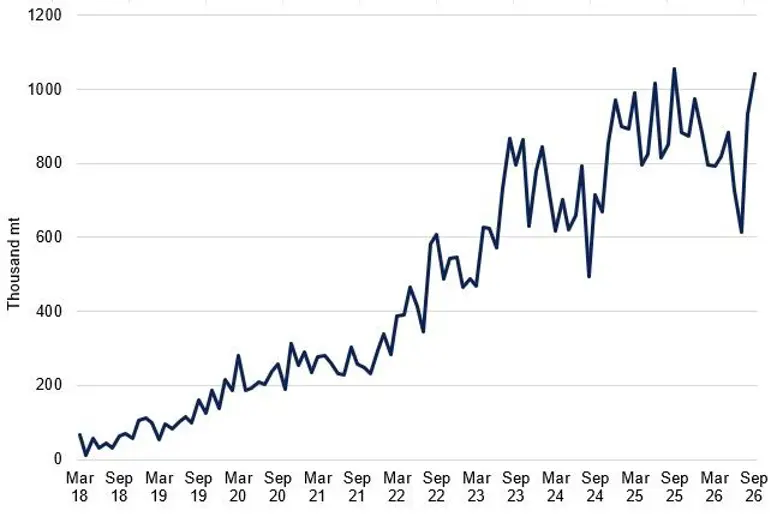
China Ferronickel Imports from Indonesia
China’s ferronickel imports from Indonesia have surged, underscoring the resilience of regional availability.
Source: Customs General Administration
Demand is not strong enough to absorb available supply. Battery demand has been revised higher, helped by resilient mid-nickel NMC chemistries, but stainless steel still represents roughly 70% of nickel use and that segment continues to weaken. Greater scrap consumption and lower nickel intensity are slowing primary demand growth, so stronger battery demand does not materially alter the well-supplied balance while Indonesian output remains high.
Inventories reinforce the view that material remains readily available. LME stocks reached about 280,000 tonnes in October, up 12% YoY, while SHFE warrant stocks stood at 93,000 tonnes on 16 October. Indonesian Class 1 metal in the LME system has also increased as cathode capacity ramps. These stocks should continue to limit the scale and duration of rallies. The main upside catalyst would be confirmed Indonesian production cuts large enough to alter expectations for future supply.
Q4 Outlook:
We retain a rangebound view with scope for a modest rebound from the $15,000/t area. However, strong mined and finished supply and ample inventories should prevent a sustained rally under the base case. The clearest upside catalyst is confirmed Indonesian production cuts—through binding company-level ore quotas, prolonged utilisation reductions or closures—that materially reduce expected supply. Until then, policy headlines may generate sharp rallies but are unlikely to sustain prices above $17,000/t.
Tin
Key Points
Tin prices corrected in October as speculative length declined, but falling exchange inventories and nearby backwardation point to a tighter prompt market.
Improving Myanmar feedstock and higher Chinese imports should gradually ease the balance, although smelting constraints and concentrated supply keep physical buffers thin.
We retain a cautiously constructive Q4 view: low stocks support prices, while renewed upside requires continued inventory draws or fresh disruption.
Tin remains one of the more volatile base metals. After approaching $56,700/t in August, LME prices fell to about $50,500/t by mid-October as investor conviction and macro risk appetite weakened. Yet this correction contrasts with tighter physical indicators, suggesting that improved longer-term supply expectations have not translated into greater immediate availability.
Positioning helps explain the recent decline. LME investment-fund net length fell from about 2,700 lots in mid-August to 1,850 by 16 October as funds took profits when momentum faded. Commercial participants initially expanded net shorts during the rally, consistent with producer hedging, but later covered part of those shorts as prices fell, suggesting less willingness to hedge at lower levels. The withdrawal of speculative length amplified the correction even as physical conditions tightened. Crowding is now less pronounced, limiting another large liquidation-driven fall, although renewed investor buying may still be needed for a sustained advance.
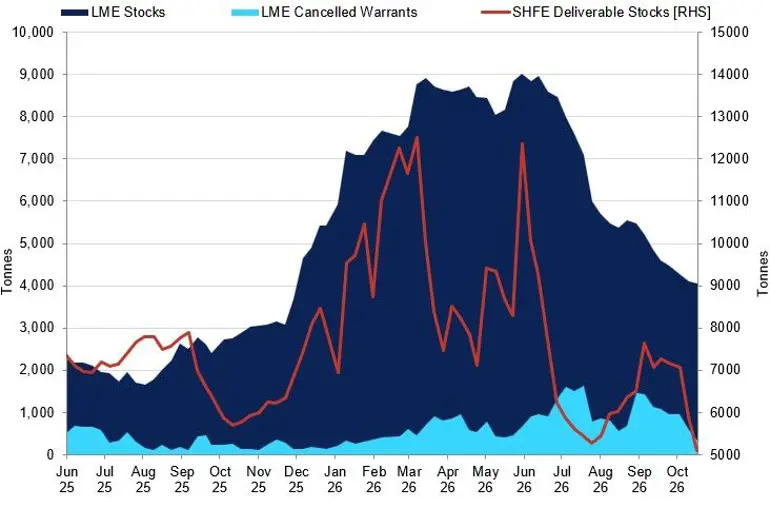
Physical conditions are firmer. LME inventories have fallen about 53% since early July to 4,045 tonnes, while SHFE weekly stocks declined to about 5,000 tonnes in mid-October, leaving combined visible stocks near 9,100 tonnes. LME cash-to-three-month spreads moved from substantial contango into backwardation, while China’s nearby SHFE premium widened. Lower stocks and tighter spreads indicate that immediately deliverable metal is becoming more valuable. Unless inventories stabilise or nearby tightness eases, the physical market should continue to provide a floor beneath outright prices.
LME Stocks vs SHFE Tin Inventories
Exchange inventories tightened sharply after mid-year peaks, with both LME and SHFE stocks falling into late October.
Source: LME, SHFE
Chinese refined supply remains constrained. Q3 smelting output was about 11% below Q2 despite a September recovery, while Yunnan Tin began maintenance on 30 September for up to 45 days. September refined imports rose to a 12-month high of 3,890 tonnes, around 70% from Indonesia, offsetting weaker domestic production without rebuilding exchange inventories. This reliance on imports leaves China exposed to Indonesian availability and regional competition for metal.
Elsewhere, supply has been steady, but Q4 risks are building. Alphamin’s Bisie operation produced 5,030 tonnes in Q3, maintaining an annualised rate near 20,000t, although El Niño could disrupt rainy-season logistics. Myanmar concentrate shipments to China recovered from 4,570 tonnes in July to 5,506 tonnes in September; total September concentrate imports reached 21,603 tonnes, led by the DRC on a contained-tin basis. This should improve feedstock availability, but additional mine supply must pass through the smelting chain before easing refined tightness. Softer concentrate prices support the improvement narrative, although part of the move reflects lower refined prices. Indonesian output remains exposed to regulatory and permitting risk. Overall, the supply base is stable rather than abundant, leaving Q4 vulnerable to weather, logistics and policy disruption.
Q4 Outlook:
Tin retains a constructive physical outlook, although outright prices should remain volatile. Low exchange inventories, nearby backwardation and temporary Chinese smelting constraints provide support, while recovering Myanmar feedstock and higher refined imports should gradually ease the balance. A stronger rally would require continued inventory depletion, persistent backwardation or fresh disruption in the DRC, Myanmar or Indonesia. Conversely, recovering Chinese refining and rebuilding exchange stocks would weaken the physical premium and allow a further correction. On balance, the prompt market remains tighter than the outright price suggests, but improving upstream availability should prevent a broader shortage under the base case.
Zinc
Key Points
A deepening concentrate shortage is constraining refined output, with record-low treatment charges confirming that mine supply remains the weakest part of the chain.
London availability has tightened again following September’s stock inflows, leaving spreads increasingly sensitive to warrant cancellations and further Chinese exports.
Weak construction demand should balance stronger grid-related consumption, keeping outright prices dependent on prompt tightness.
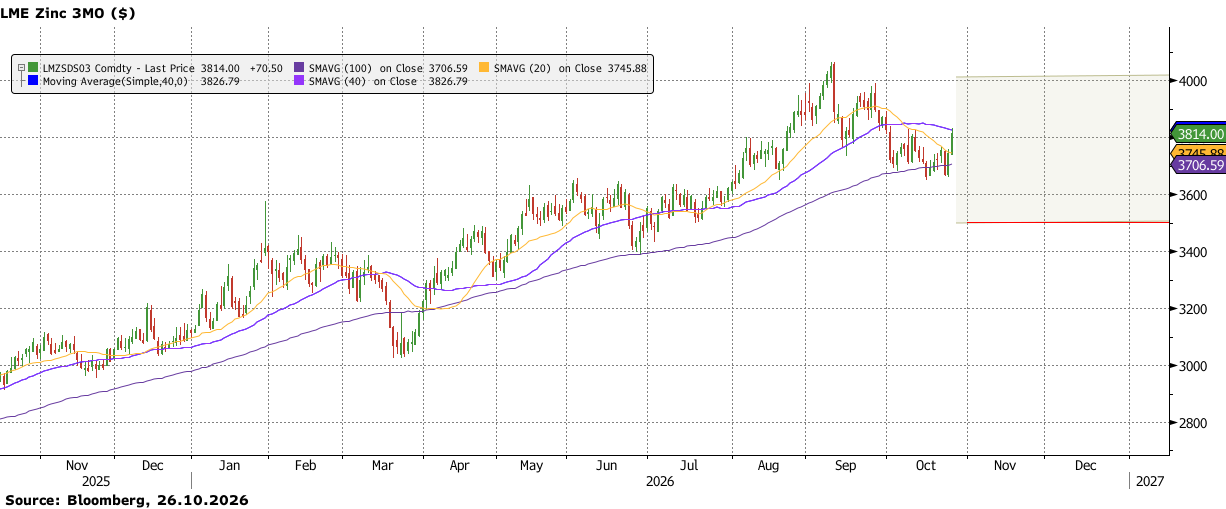
Zinc enters the final quarter of 2026 with stronger physical support than earlier in the year, although the scale of the shortage is considerably smaller than a direct comparison between mine output and refined consumption would suggest. On 26 October, LME three-month zinc reached a two-week high of $3,800.50/t, while the cash-to-three-month backwardation widened to around $80/t. The spread has doubled since Chinese metal eased September’s squeeze in early October, showing that nearby availability is tightening again even as total LME stocks have recovered to around 167,000t.
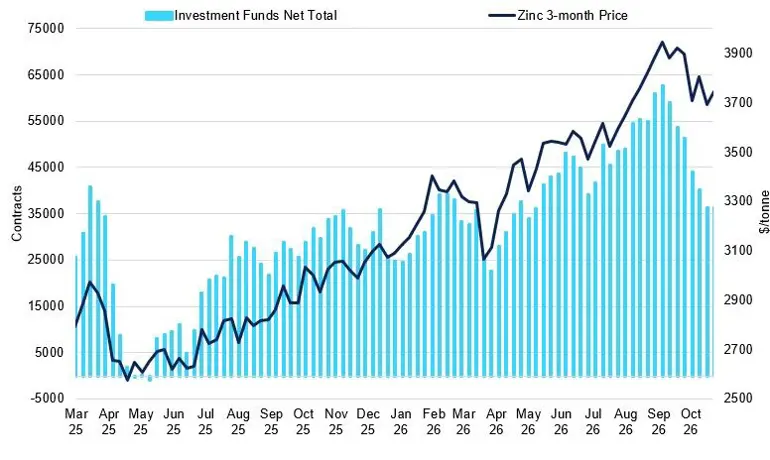
LME Zinc: Investment Funds Total vs Price
Fund length has fallen from recent highs, while zinc prices remain supported by physical tightness.
Source: LME, Sucden Financial
According to the International Lead and Zinc Study Group, the refined market is forecast to record an 88,000t deficit in 2026, equivalent to approximately 0.6% of global usage. Mine production is expected to fall 2.6% to 12.40mt, while refined output should rise by only 0.9% to 13.93mt, supported entirely by growth in China. Production outside China is forecast to decline by 2%. Refined usage should increase by 1.4% to 14.02mt. The deficit provides a stronger fundamental floor than anticipated earlier in the year but remains too small to determine prices independently of exchange stocks and spreads.
Concentrate availability is the principal constraint. Spot treatment charges for imported material have fallen to between minus $115/t and minus $150/t CIF China, indicating that smelters are paying increasingly aggressive terms to secure feedstock. Chinese refined output declined 6.4% YoY in September and is expected to remain lower in October as negative treatment charges and lower sulphuric acid prices squeeze margins. Antamina represents the most significant individual loss, with zinc output affected by a planned shift towards copper-only ore. Lower grades at Red Dog, the disruption at Garpenberg, reduced guidance from Glencore and delayed Russian supply have added to the shortfall.
London market structure should remain the clearest near-term price signal. Of the 167,000t held in LME warehouses, approximately 134,000t remains on warrant, while cancelled warrants have risen to 33,000t, equivalent to 20% of total stocks. Concentrated warrant and cash positions increase the market’s vulnerability if this metal is withdrawn. China exported 70,400t of refined zinc in September, but the export window has since closed. Without another inflow, further cancellations could quickly restore the more severe tightness seen in September.
Demand remains uneven. Improved orders for transmission towers provide support, but Chinese galvanising utilisation of around 56% reflects continued weakness across property, pipes, solar mounting systems and exported steel products. Chinese usage is forecast to grow by 1.8% in 2026 before slowing to 0.3% in 2027. Weak construction should therefore balance demand from power-grid investment rather than create the conditions for a broad consumption-led rally.
Q4 Outlook:
We expect zinc to remain supported through mid-January, with prompt availability, cancelled warrants and treatment charges driving price direction. The cash-to-three-month spread could tighten further if warranted metal leaves London without renewed Chinese exports. However, subdued construction demand and the prospect of additional refined output should limit the sustainability of rallies. Under our base case, zinc should remain elevated but volatile, with support around $3,500/t and resistance emerging around $4,000/t.
Iron Ore & Steel
Key Points
Iron ore remains under pressure as rising port inventories and resilient imports contrast with contracting Chinese steel output and weak downstream demand.
Property and construction weakness continue to outweigh targeted stimulus, while mixed finished-steel inventories suggest destocking partly reflects production restraint rather than stronger consumption.
We retain a bearish Q4 bias near $90/t, with rallies likely capped unless port stocks decline alongside improving profitable hot-metal production or seaborne supply is disrupted.
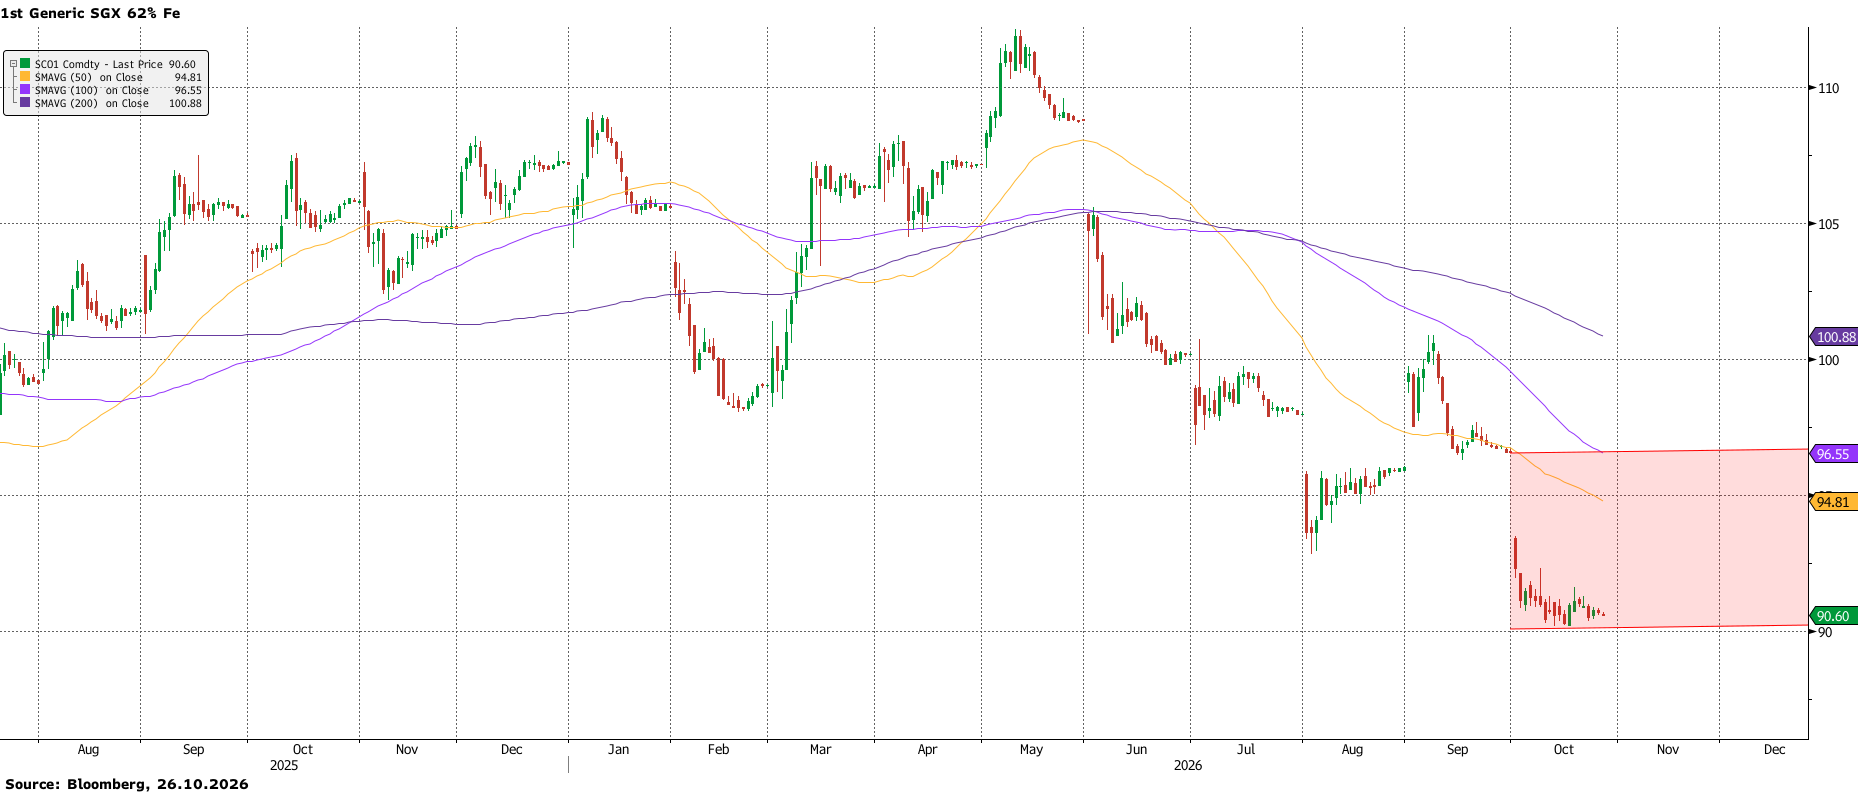
Iron ore entered Q3 near $100/t, but the market increasingly doubted that China’s seasonal steel demand would absorb available supply. Brief pre-holiday restocking rallies gave way to renewed selling as mill margins weakened. China continued receiving substantial cargoes even as steel output contracted, and SGX futures settled near $90/t in mid-October. The decline reflects weak downstream demand confronting abundant raw-material supply.
The imbalance is clearest in inventories. Iron ore port stocks reached 153.1Mt on 16 October, up 14.7% YoY, reducing mills’ urgency to replenish. Finished-steel inventories present a more nuanced picture: combined stocks of rebar, wire rod, plate, hot-rolled coil and cold-rolled coil fell 8.9% in September but remained 4.3% above the previous year. Rebar and wire-rod stocks were lower YoY, whereas plate and HRC inventories were 14.3% and 26.9% higher, respectively. Lower long-product inventories do not necessarily indicate stronger construction demand, as restrained production may also have driven destocking. Meanwhile, elevated plate and HRC stocks suggest supply continues to exceed demand in parts of the flat-steel market.
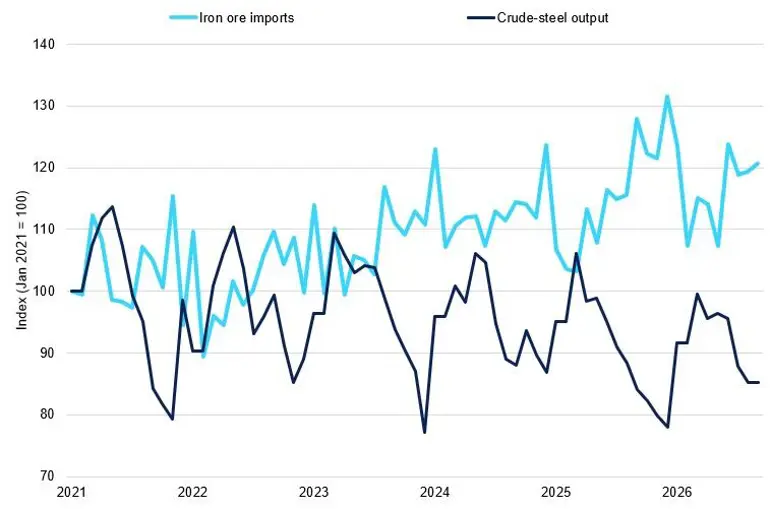
The more striking mismatch is upstream. China imported 955Mt of iron ore in January–September, up 4.0% YoY, despite crude-steel output falling 2.7% to 725.2Mt. Imports have remained resilient partly because seaborne ore has displaced domestic supply, but expanding inflows alongside contracting steel production are also consistent with material accumulating at ports. The raw-material market remains more amply supplied than downstream conditions justify, keeping pressure on prices and limiting the durability of restocking rallies.
China Iron Ore Imports vs Crude-steel Output
China’s iron ore imports have trended upward despite weakening crude-steel production, highlighting a widening disconnect between raw-material inflows and output.
Source: General Administration of Customs of China, National Bureau of Statistics of China
China’s property downturn remains the principal source of construction-demand weakness. By September, cumulative real-estate fixed-asset investment had contracted 21.5% YoY, while infrastructure investment fell 13.3% and construction fixed-asset investment declined 11.3%. Mills have responded, but the 2.7% decline in crude-steel output remains modest relative to the contraction in investment. Rebar and other construction-linked products therefore remain vulnerable unless production falls further or fixed-asset demand stabilises. Local incentives to protect output and employment may slow the adjustment, prolonging weak margins.
Beijing’s late-September stimulus provides a cushion rather than a new steel-intensive growth cycle. The PBoC cut the pledged supplementary lending rate from 1.75% to 1.5% and extended support to six infrastructure networks, including power grids, water systems, digital infrastructure and logistics. Targeted mortgage subsidies may assist eligible first-time buyers but do little to repair developers’ balance sheets or revive new construction. Not all announced spending will be delivered quickly, and several supported areas are less steel-intensive than residential building. Policy should therefore slow deterioration rather than reverse the Q4 demand trend.
Q4 Outlook:
Iron ore retains a bearish bias, with $90/t viewed as firm cost-based support. Rallies are likely to be constrained by elevated port stocks, weak mill profitability and limited property-led stimulus. Seasonal restocking may interrupt the decline, but a sustained recovery requires inventory drawdowns alongside improving profitable hot-metal production, or disruption to seaborne supply. Until then, abundant ore availability should outweigh intermittent policy optimism.
Gold
Key Points
Gold’s near-term direction remains tied to the Fed, with the Iran conflict affecting bullion primarily through oil, inflation expectations and interest rates.
Central-bank and ETF buying should continue to cushion corrections, although neither is likely to overcome a further hawkish repricing of US monetary policy.
We expect gold to remain under pressure into December before stabilising as the Fed approaches the end of its tightening cycle.
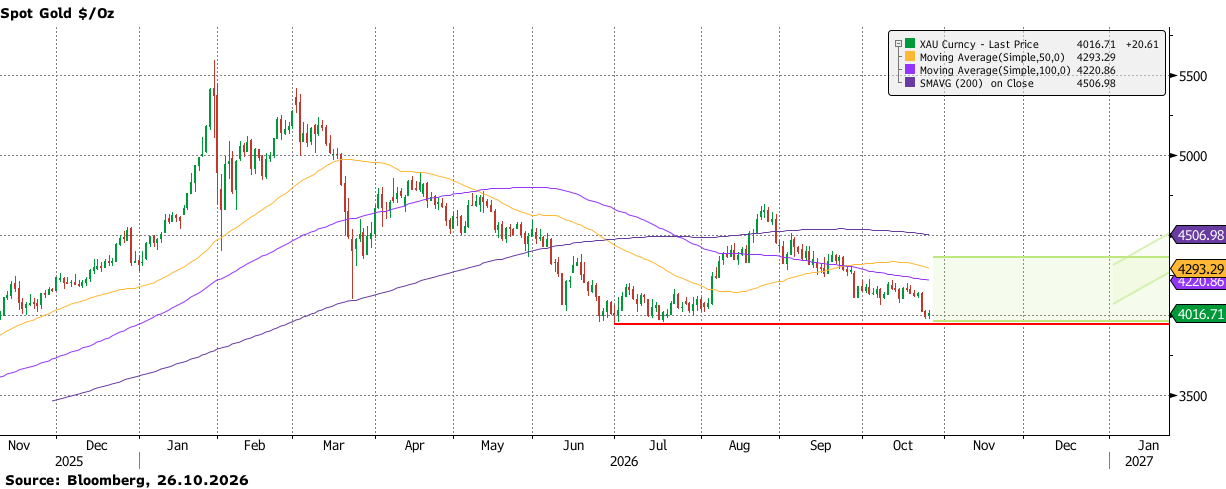
As October draws to a close, gold is trading close to $4,000/oz, having fallen to its weakest level since July as the Iran conflict continues to work against, rather than in favour of, bullion. The main transmission channel remains oil. Brent above $110/bl has reinforced inflation concerns, supported the dollar and kept Treasury yields elevated, increasing the opportunity cost of holding gold. Safe-haven demand has remained secondary. Recent price action, including gold’s recovery as oil eased from last week’s highs, confirms that the market is trading the conflict through its implications for monetary policy.
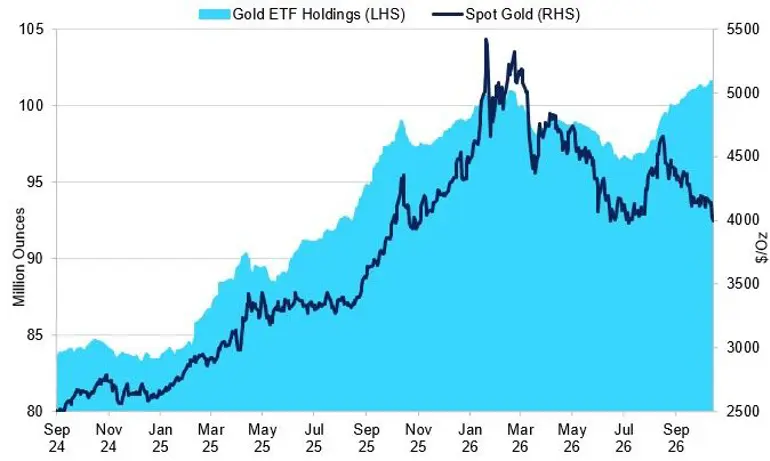
Total Gold ETF Holdings
Gold ETF holdings have been rising steadily despite lower prices.
Source: FRED
The Fed therefore remains the principal price-setter. September’s 25bp increase brought the target range to 3.75-4.00%, while policymakers’ projections indicate one further hike before rates are held through 2027. An October pause is largely priced in, leaving December as the more important decision. Until the market gains confidence that the tightening cycle is complete, gold should remain highly sensitive to oil, PCE inflation, payrolls and CPI. A credible decline in energy prices would be more supportive than renewed military escalation because it would reduce the need for further tightening and allow yields and the dollar to soften.
Official-sector demand continues to provide the clearest fundamental floor. Central banks purchased an estimated 289t in Q2, including unreported activity, although first-half demand remained the weakest since 2022 after Q1 purchases were revised sharply lower. Reported monthly buying has subsequently strengthened, led by China. The PBoC added 23t in September, taking year-to-date purchases to 103t and extending its buying streak to 23 months. Poland also remains an important buyer, although purchases could slow as holdings approach the central bank’s 700t target. Selling by Turkey and Russia highlights that the official sector is not uniformly supportive, particularly if higher energy costs create pressure to mobilise reserves.
Investment flows are similarly divided. Gold ETF holdings reached a record 101.55Moz in mid-October and remain close to 101Moz, showing that investors continued to accumulate gold despite the recent price correction. Futures investors have moved in the opposite direction, with managed-money length declining to a four-month low. This leaves the market less exposed to a crowded-long liquidation, but also without the speculative participation required for a sustained recovery. Headline-driven volatility is therefore likely to remain concentrated in futures, while ETFs and central banks continue to absorb weakness.
Mine supply should have limited influence over the quarter. Record first-half production and strong producer margins indicate that output remains responsive despite isolated operational constraints.
Q4 Outlook
We expect gold to remain vulnerable to tests below $4,000/oz ahead of the December Fed meeting, with $3,900/oz providing the next meaningful support. As the final hike is absorbed and the policy path becomes clearer, prices should stabilise and gradually recover towards $4,200-4,300/oz by mid-January. A sustained move above that area would require a clearer decline in oil, US yields and the dollar.
Silver
Key Points
Silver remains more sensitive than gold to US interest-rate expectations, leaving the Fed, oil prices and the dollar as the principal drivers into January.
Industrial demand is weakening as the solar sector reduces silver intensity, limiting support from the physical market despite another annual deficit.
Light speculative positioning and constrained freely available inventories should cushion weakness, but a sustained recovery requires the market to conclude that the Fed has finished tightening.
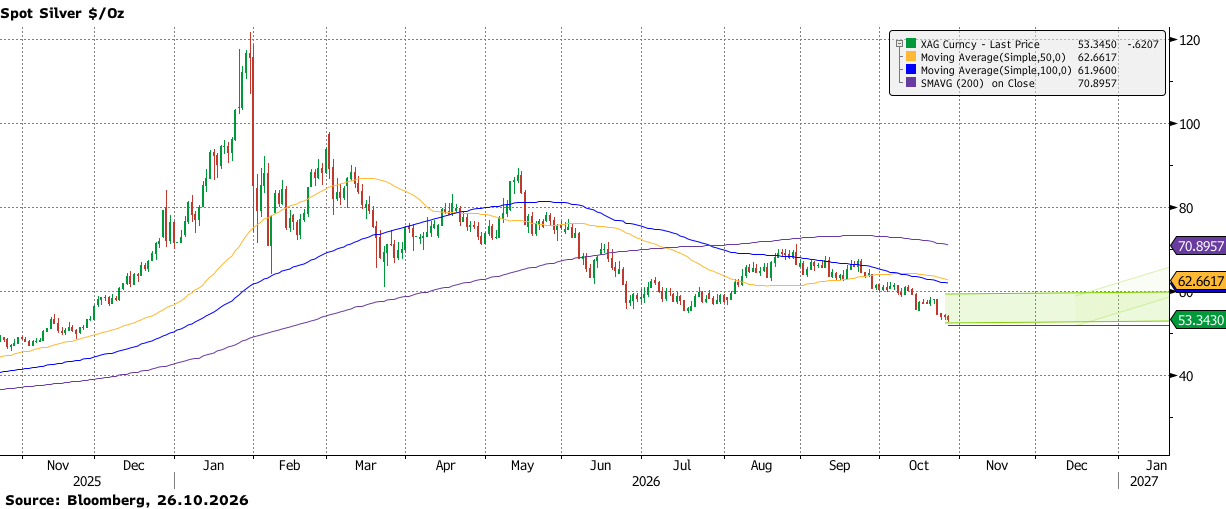
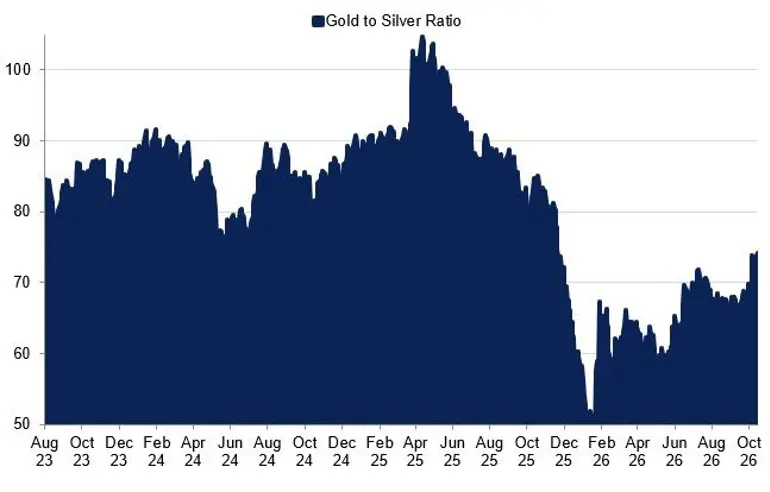
Silver enters the last week of October near $54/oz, around 55% below January’s record high of $121.62/oz. The scale of the correction has removed much of the speculative premium built during the Q1 rally, but volatility remains elevated. In the week ending 23 October, COMEX silver fell nearly 6% to $53.95/oz, compared with a roughly 4% decline in gold, demonstrating silver’s greater sensitivity to changes in US rate expectations, the dollar and investor positioning. The gold-to-silver ratio has widened to around 74, reflecting silver’s relative underperformance as monetary conditions tightened.
Gold to Silver Ratio
The gold-to-silver ratio has rebounded to around 74, reversing part of its earlier decline as gold outperforms silver.
Source: COMEX
Silver’s higher sensitivity to monetary-policy expectations should remain the dominant influence through mid-January. The metal rallied 15.6% in August after weaker US employment data reduced expectations for further tightening, before falling around 8% following Chair Warsh’s hawkish Jackson Hole speech and the September rate increase. With the policy rate now at 3.75-4.00% and markets assigning more than an 80% probability to another increase in December, the balance of risk remains tilted towards further weakness. Elevated oil prices add to this pressure by keeping inflation expectations firm and reducing the Fed’s ability to look through softer activity. This leaves silver particularly exposed to PCE inflation, payrolls and CPI, with any repricing of the December meeting likely to produce a larger move than in gold. A softer policy signal could trigger a sharp recovery, but a sustained improvement is unlikely until investors gain confidence that the tightening cycle has ended.
Physical fundamentals are becoming less supportive within this horizon. The World Silver Survey 2026 forecasts industrial fabrication, which accounts for about 57% of demand, to decline by 3% in 2026 to 639.6Moz. Photovoltaic demand is expected to fall by 19% to around 151Moz as manufacturers reduce silver loadings and begin adopting copper-based technologies. Demand from electric vehicles, power grids and data centres continues to expand, but should only partly offset falling solar use and weaker jewellery and silverware consumption.
Mine supply is forecast to edge 0.3% lower to 844Moz. With only around 26% of production coming from primary silver mines, higher prices have limited ability to stimulate supply because most output is produced alongside lead, zinc, copper and gold. The market should consequently record a sixth consecutive deficit, although the expected 46Moz shortfall is considerably smaller than in 2022. This supports the longer-term floor but is unlikely to determine prices before mid-January.
Investment signals remain mixed. Silver ETFs hold around 805.8Moz after net selling this year, contrasting with continued accumulation in gold. Hedge funds are only modestly net long, while the recent increase in short positions creates scope for a sharp short-covering move if the Fed turns less hawkish. At the same time, declining COMEX registered inventories and limited freely available metal in London leave the market vulnerable to renewed physical tightness.
Q4 Outlook:
We expect silver to remain under pressure ahead of the December Fed meeting, with $50-53/oz providing the main support area. As the final rate increase is absorbed, prices should stabilise and recover towards $57-60/oz by mid-January. A more sustained move above $60/oz requires lower oil prices and softer US yields.
PGMs
Key Points
PGMs will likely remain sensitive to US rate expectations, but neither has the investment support or central-bank demand that has provided a floor for gold.
Platinum’s 2026 surplus reflects earlier investor selling rather than a broad deterioration in physical consumption, while palladium remains constrained by declining autocatalyst demand.
We expect both metals to stabilise once the final Fed increase is absorbed, although platinum should retain the stronger medium-term outlook.
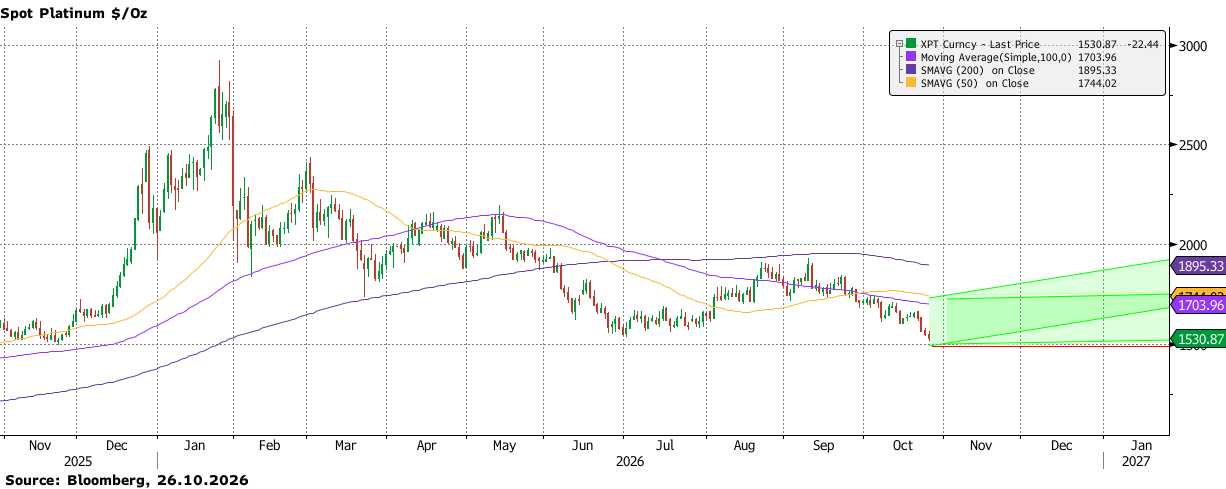
Platinum and palladium enter the final quarter of 2026 under renewed pressure from higher US rates, a firm dollar and weaker investor demand. On 23 October, platinum traded at $1,556/oz, its lowest level since July and around 46% below January’s record high. Palladium fell to $1,048/oz, its weakest level since June 2025 and approximately 17% below its 23 September level. Their simultaneous rebound alongside gold and silver on 19 October confirmed that macro flows, rather than individual fundamentals, remain the principal short-term driver.
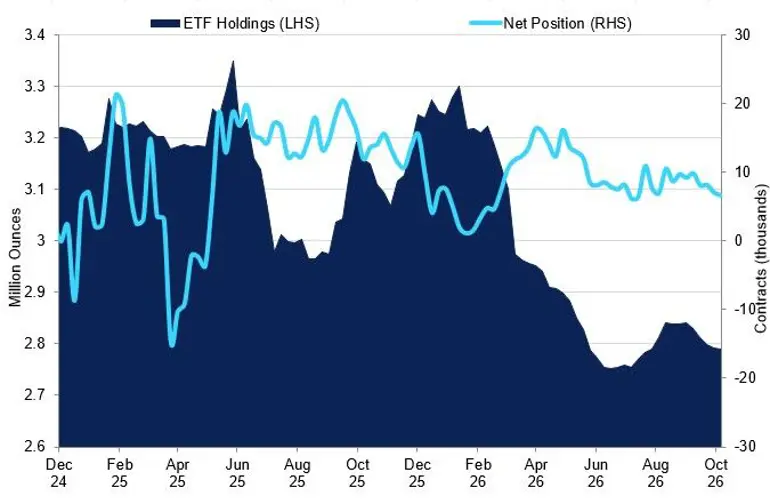
Platinum ETF Holdings vs Managed Money Net Position
Recent months have seen ETF holdings stabilise near multi-year lows, while managed-money positioning has remained modestly net long.
Source: CFTC
The September rate increase to 3.75-4.00%, Treasury yields near 5% and the prospect of another move in December have raised the opportunity cost of holding non-yielding metals. The Iran conflict has reinforced this pressure through higher oil prices and inflation expectations. Unlike gold, PGMs lack a consistent central-bank buyer. Platinum ETF outflows exceeded 500koz during the first half of 2026, returning metal to the physical market and accounting for much of the change in this year’s balance. Meanwhile, one-month lease rates have fallen below 2% for platinum and towards 1% for palladium, signalling that the tightness evident earlier in the year has eased.
The demand outlook increasingly separates the two metals. Based on the World Platinum Investment Council’s 2026 figures, automotive demand is forecast to fall 4% to 2.90Moz, but industrial consumption should rise 5% to 2.39Moz, supported by glass and electronics applications linked to AI infrastructure. Chinese imports also remain resilient, reaching 1.85Moz through August despite a 15% decline in jewellery demand. Palladium remains considerably more exposed to the automotive transition, with autocatalysts representing around 82% of gross demand. Rising battery-electric vehicle penetration and weaker production of catalyst-equipped vehicles in China should keep consumption under pressure. Platinum’s premium of roughly $500/oz creates an incentive for manufacturers to substitute back towards palladium, although redesign and certification requirements mean this will not materially change demand during the forecast period.
Supply is unlikely to determine prices unless a major operation is disrupted. Platinum mine output is forecast to remain broadly stable at 5.55Moz, while palladium production is expected to decline by around 5% to 5.83Moz. Maintenance-related disruption at Valterra is expected to reverse during Q4, while the end of the Stillwater strike should restore some US palladium supply. Higher recycling, including a projected 15% increase in autocatalyst scrap, will likely provide a more immediate source of additional metal.
The platinum market is now forecast to record a 265koz surplus in 2026, primarily because of first-half investment outflows, although the second-half balance remains tight and deficits are expected to return from 2027. Palladium retains a physical deficit before investment flows, but its longer-term outlook remains weakened by declining autocatalyst demand.
Q4 Outlook:
We expect platinum to stabilise around $1,500-1,550/oz before recovering towards $1,700-1,800/oz by mid-January as the Fed approaches the end of its tightening cycle. Palladium should remain the weaker metal, with support near $1,000/oz and recovery potential limited to $1,150-1,250/oz. A stronger move in either market would require a clear turn in US rate expectations or a material mine disruption.

